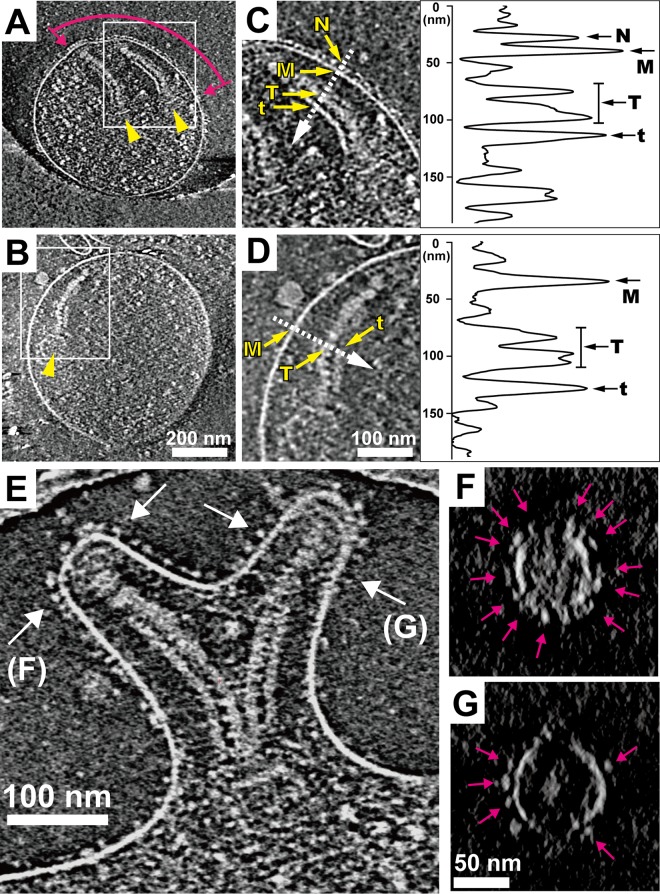
FIG 2 .
Analysis of the organelle surface by ECT. (A, B) Images of 15-nm-thick slices through the tomograms of wild-type (A) and class IV-22 mutant (B) cells. The extent of the distribution of knoblike particles on the membrane surface is indicated by a pair of magenta arrows. The internal core of the attachment organelle is indicated by yellow arrowheads. (C, D) Magnified images of the internal core of a wild-type cell (C) and a class IV-22 mutant cell (D), respectively. The yellow arrows indicate the knoblike particle (N), cell membrane (M), thick plate (T), and thin plate (t) of the internal core. Density profiles across the membranes of the wild-type cell and the class IV-22 mutant cell (dashed-line arrows) are shown in the panels to the right. (E) A 15-nm-thick slice through the tomogram of a bifurcated attachment organelle. (F, G) Cross sections of the tomogram in panel E at the positions indicated by the two pairs of arrows labeled F and G; the slices are 18 nm thick. The pink arrows indicate the knob domains of the P1 adhesin complexes on the membrane surface. For the view in panel G, a series of cross sections through the axis of protrusion can be seen in Video S3.

