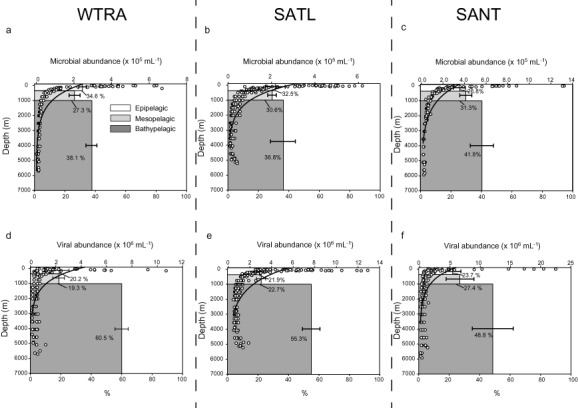
Figure 3.

Average integrated microbial (A–C) and viral (D–F) abundance (average and % of total abundance) in the epi‐, meso‐ and bathypelagic layers of the different oceanic provinces WTRA (A, D), SATL (B, E) and SANT (C, F). The open dots represent the microbial and viral abundances with the best‐fit regression line through the data points.
