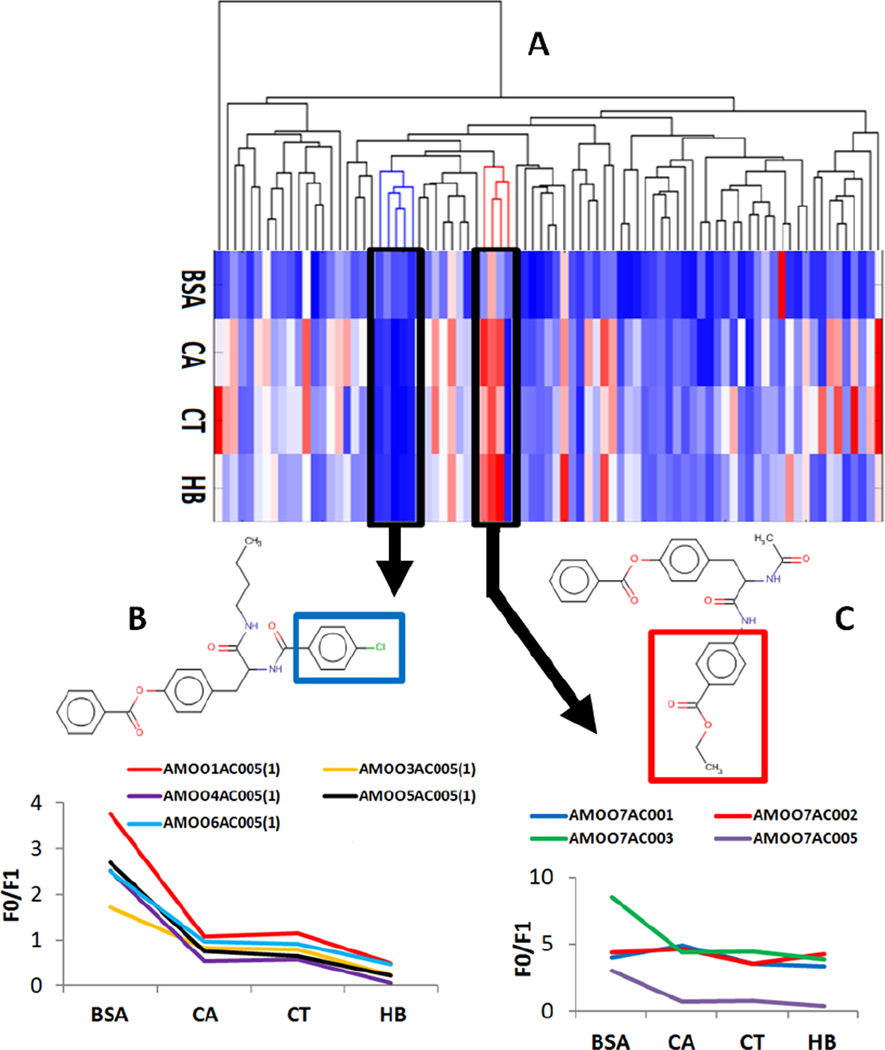
Figure 1.
Clusters of CNTs; protein binders are shown in red and non-binders are in blue. (A) Dendrogram generated with non-supervised hierarchical clustering method; the heatmap represents the protein binding activities of the CNTs ordered according to the dendrogram. Red color stands for high activity while blue color for low activity. (B) The blue cluster represents five compounds incorporating common substructure (benzene chloride) highlighted in blue square. They behave similarly (low) activity in four protein binding assays. (C) The red cluster represents four compounds sharing a common substituent (ethyl benzoate, highlighted in the red square) causing similar (strong) protein binding responses as measured in four different assays.

