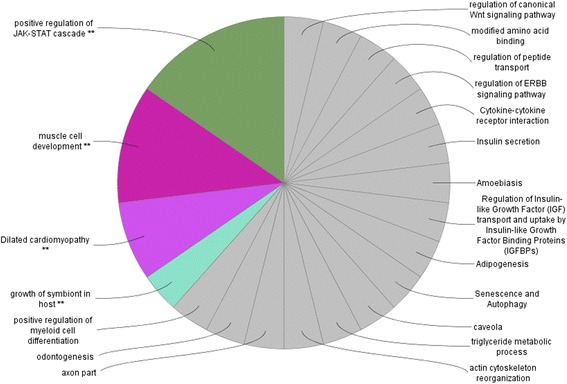
Fig. 5.

The pathway distribution of the specific clusters for all DEGs. Analysis performed in Cytoscape-ClueGo. The selection criteria for this network were to have at least two genes per node with a minimum of 5 % of the associated genes from all loaded genes in one node. The group percentage was 50 % with a kappa score threshold of 0.4
