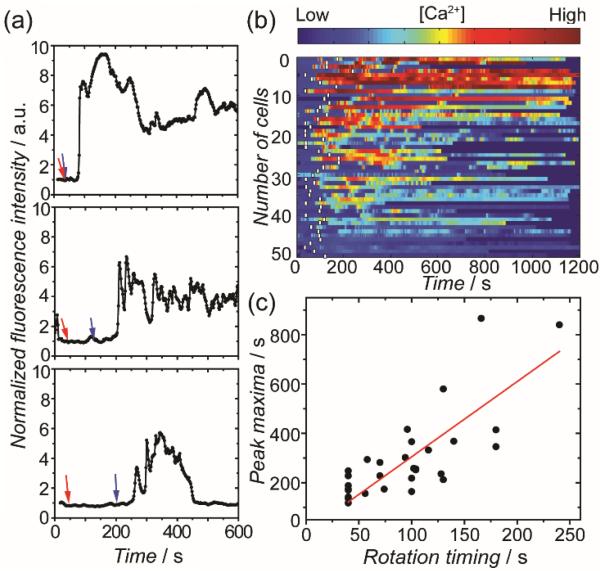
Figure 3.
Manipulation of the Initiation of T cell activation. (a) Plots showing the calcium response of three representatve cells as a function of time. In all plots, red arrows indicate the time when the metal-coated hemisphere made contact with T cells and blue arrows indicate the time when the anti-CD3 coated hemisphere was rotated to face the cells. (b) Color-scaled heatmap showing calcium response of T cells (N = 51). White bars indicate the time when the anti-CD3-coated hemispheres were rotated to face T cells. (c) A plot showing the time of the calcium peak as a function of the rotation timing, which is defined as the time from when the metal side of a particle faced a T cell to when the anti-CD3 coated side was rotated to face the cell. The Pearson's coefficient is 0.76.

