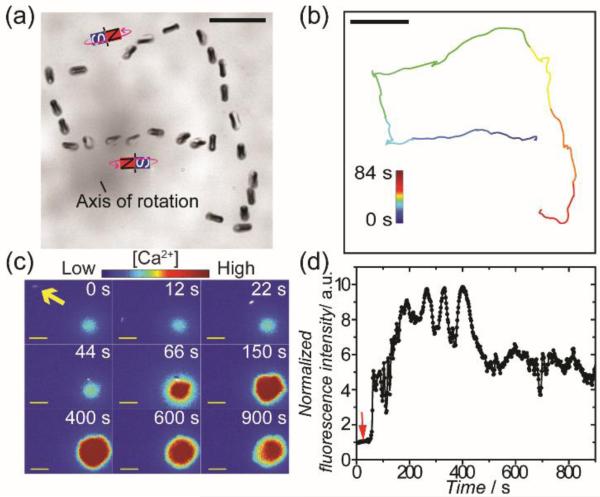
Figure 4.
Remote control of T cell actvation using magnetic Janus rods. (a) Superimposed bright-field images showing the magnetic control of the rotation and locomotion of Janus rods. (b) Trajectory of the Janus rod shown in (a). (c) Fluorescence images showing T cell actvation by a rotating Janus rod (indicated by the yellow arrow). Images are color-coded based on the fluorescence intensity of the calcium reporter Fluo-4 in cells. (d) The normalized fluorescence intensity of the T cell shown in (c) is plotted against time to show the time dependence of the T cell actvation. Red arrow indicates the time when the Janus rod was rotated to make initial contact with the T cell. The results are representative of N = 18 cells. Scale bars: 10 μm.

