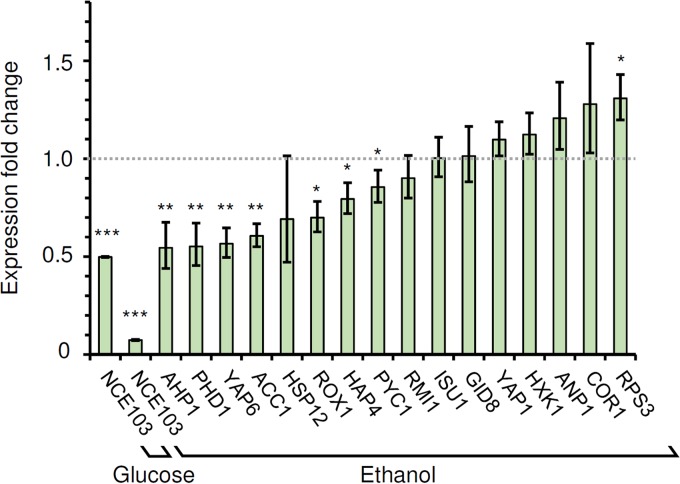
FIG 3 .
Fold changes in expression levels of Cst6p target genes in the cst6Δ strain relative to their expression in the wild type. The data represent the average results and standard deviations from biological triplicates. *, P ≤ 0.05; **, P ≤ 0.01; ***, P ≤ 0.001. A fold change of one (no change) is indicated by the dotted line.

