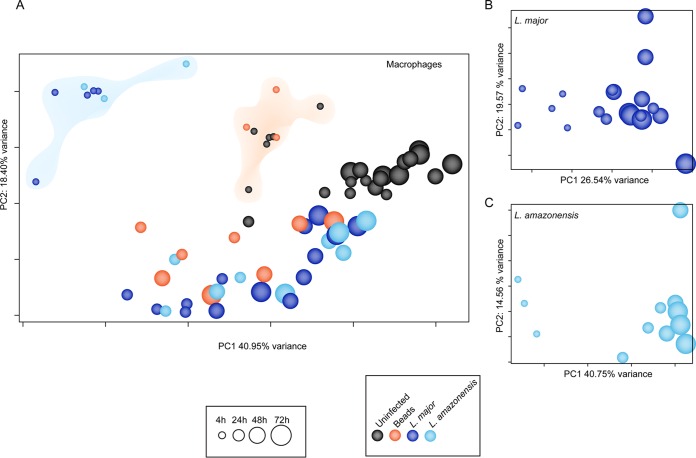
FIG 3 .
Global expression profiles of human macrophages and Leishmania parasites during infection. A comprehensive PCA was conducted to evaluate the relationships between samples across time points and to visualize sample-sample distances for human macrophages (uninfected controls, Leishmania-infected cells, and bead-containing cells) (A) and the intracellular forms of Leishmania (B and C). Each sphere represents an experimental sample, with increasing size indicating the progression of time points from 4 to 72 hpi. Sphere colors indicate sample type (shown in color key). In panel A, the clouds highlight the separation of the Leishmania-infected cluster (blue) from the uninfected/bead-containing cluster (orange). All analyses were performed after filtering out nonexpressed or lowly expressed genes, performing quantile normalization, and including experimental batch as a covariate in the statistical model. PCA plots showing the effects of batch adjustment in macrophage and parasite samples are shown in Fig. S1 and Fig. S2 in the supplemental material.

