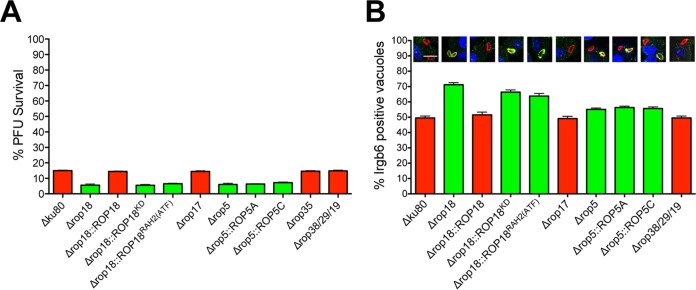
FIG 5 .
Type II ROP5 and ROP18 resist Irgb6 coating and killing of the PV. (A) MEFs were stimulated with IFN-γ, and parasite survival (measured as PFU) was determined in comparison to nonstimulated MEFs. Results are from at least four independent experiments and are shown as means plus SEM. Significant P values were calculated with a Student’s t test. The values for all strains shown in red were not significantly different from the value for the Δku80 parent. The values for all strains shown in green were significantly different (P < 0.0001) from the value for the Δku80 parent strain. (B) Quantification of Irgb6 coating of PVs 45 min after infection of IFN-γ-stimulated bone marrow-derived macrophages. Representative images are shown of PVs stained with anti-Irgb6 (shown in green) and anti-GRA5 (shown in red). At least 500 PVs were scored to determine significance. Significant P values were calculated with a Student’s t test. The values for all strains shown in red were not significantly different from the value for the Δku80 parent. The values for all strains shown in green were significantly different from the value for the Δku80 parent strain. The P values for the knockout strains shown in green are listed in parentheses after the genotype: Δrop18 (P < 0.0001), Δrop18::ROP18KD (P < 0.0001), Δrop18::ROP18RAH2(ATF) (P < 0.0001), Δrop5 (P < 0.0013), Δrop5::ROP5A (P < 0.0001), and Δrop5::ROP5C (P < 0.0006).

