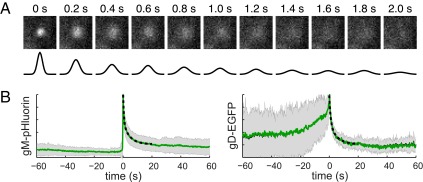
FIG 3 .
Diffusion coefficients of viral glycoproteins in the plasma membrane. (A) Still images of a representative gM-pHluorin exocytosis event over time. Diffusion coefficient of gM-pHluorin was measured by fitting a Gaussian curve (black lines) to the spatial distribution of fluorescence at each time point. All images are of a 3.6-µm area. (B) Relative fluorescence (f/f0) ensemble averages of gM-pHluorin or gD-EGFP over a 120-s time course. Diffusion coefficients were estimated by fitting the fluorescence decay curve to a biexponential model (dashed lines). Shaded areas represent standard deviations.

