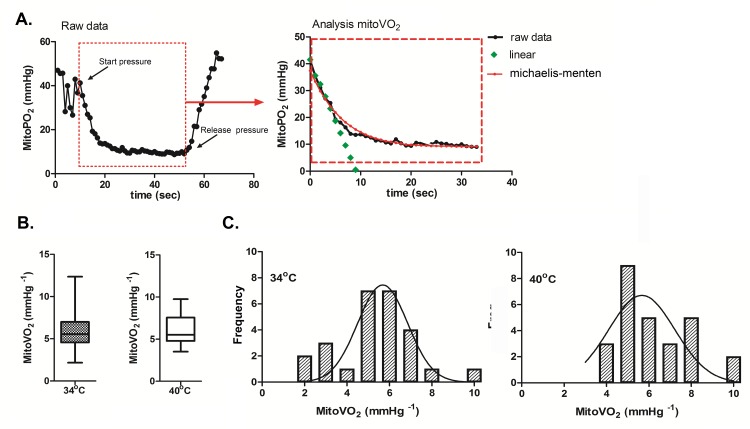
Fig 3.
A. Typical example of the analysis of the mitochondrial oxygen consumption (mitoVO2). The first panel shows an example of the oxygen disappearance rate after local occlusion of the microcirculation. In the second panel we demonstrate the analysis of the mitochondrial oxygen tension (mitoPO2), the green line represents the linear fit (ΔPO2(t)/Δt) of the oxygen disappearance rate. B. The mitoVO2 are presented in a box-and-whiskers graph. The boxes extend from the 25th percentile to the 75th percentile, with a line at the median, the whiskers extend above and below the box to show the highest and lowest values. Presented data are measured with two different probe temperatures (34°C and 40°C, respectively). C. Frequency distribution of all ratio differences of the mitoVO2 at 34°C and 40°C.

