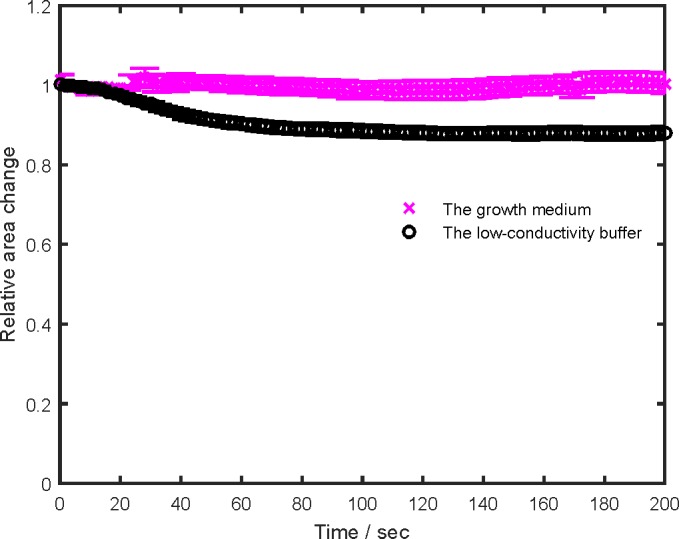
Fig 6. Cell size change dynamics in the growth medium and the low-conductivity buffer.

Symbols denote the average ± standard error. The relative change was determined as a ratio of the cell cross-section after and before the pulses. The upper magenta curve–the growth medium; the lower black curve–the low-conductivity buffer.
