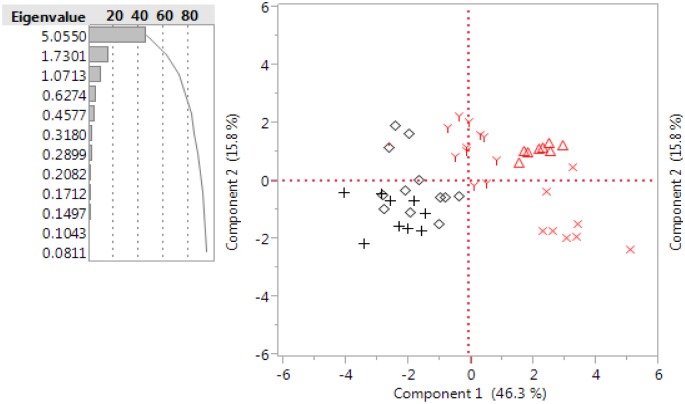
Fig 4. Two main principal components explain 62.1% of the total variation among RSCU indices.
The principal component analysis was conducted using RSCU values corresponding to 59 codons of all eukaryotic and viral species used in this study. Based on eigenvalues of 5.05 and 1.73 the first principal component one accounts for the 46.3% of the total variance, while the second principal component for the 15.8%. In black are represented the following species: (+) Orthobunyavirus, Ephemerovirus, Orbivirus and Ceratopogonide. (◊) Vesiculovirus, Phlebovirus and Psychodidae. In red are represented the following species: (Y) Flavivirus, Alphavirus and Thogotoviridae. (Δ) Vertebrates. (X) Culicidae and Arachnida.

