Fig 2.

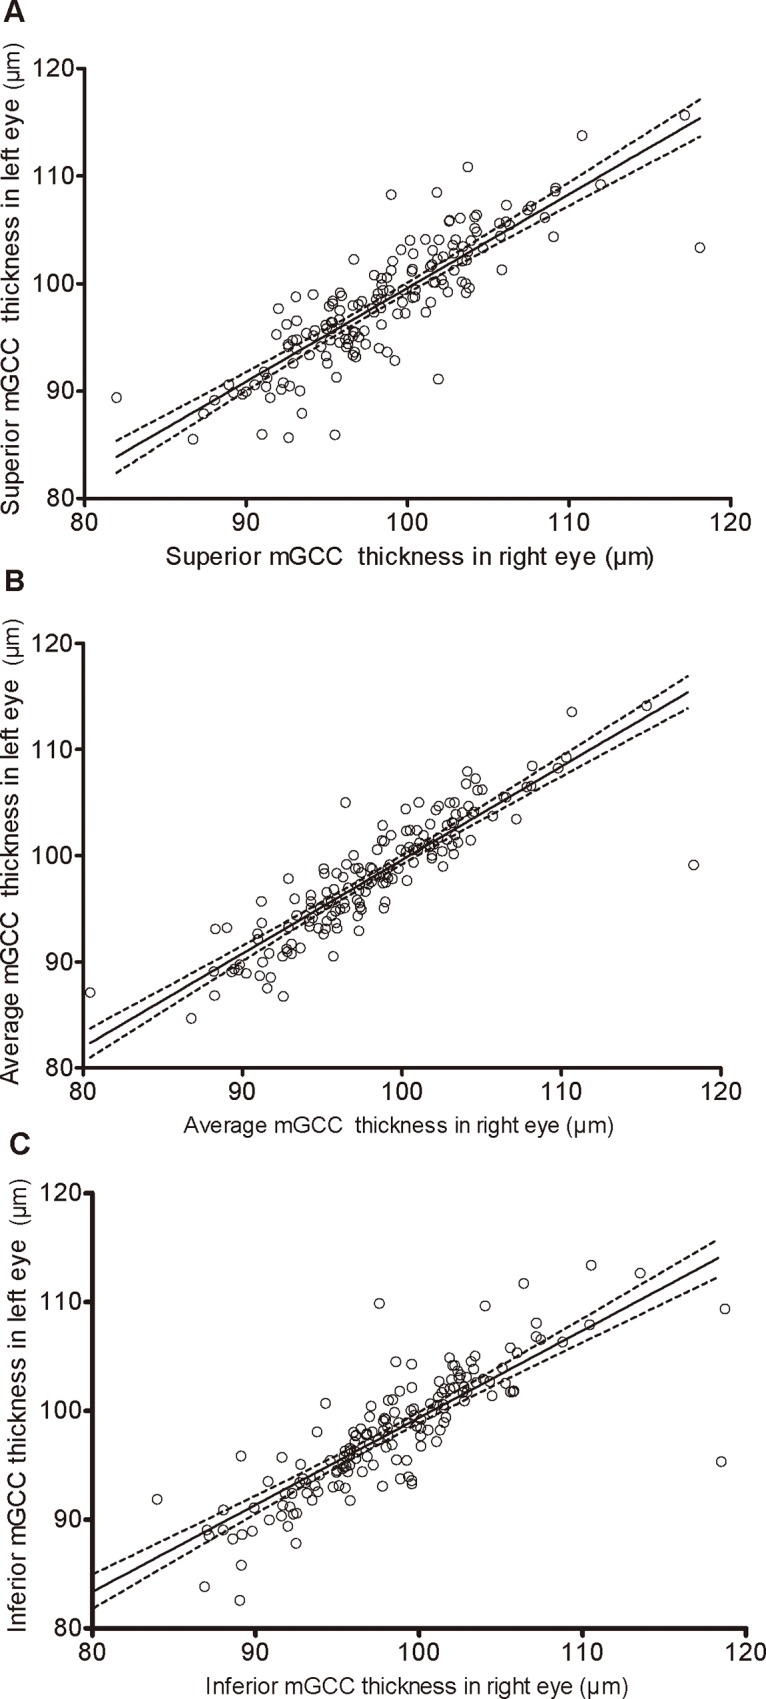
Scatterplots showing relationship between superior (A), average (B), and inferior (C) mGCC thickness in right eye and in left eye.

Scatterplots showing relationship between superior (A), average (B), and inferior (C) mGCC thickness in right eye and in left eye.