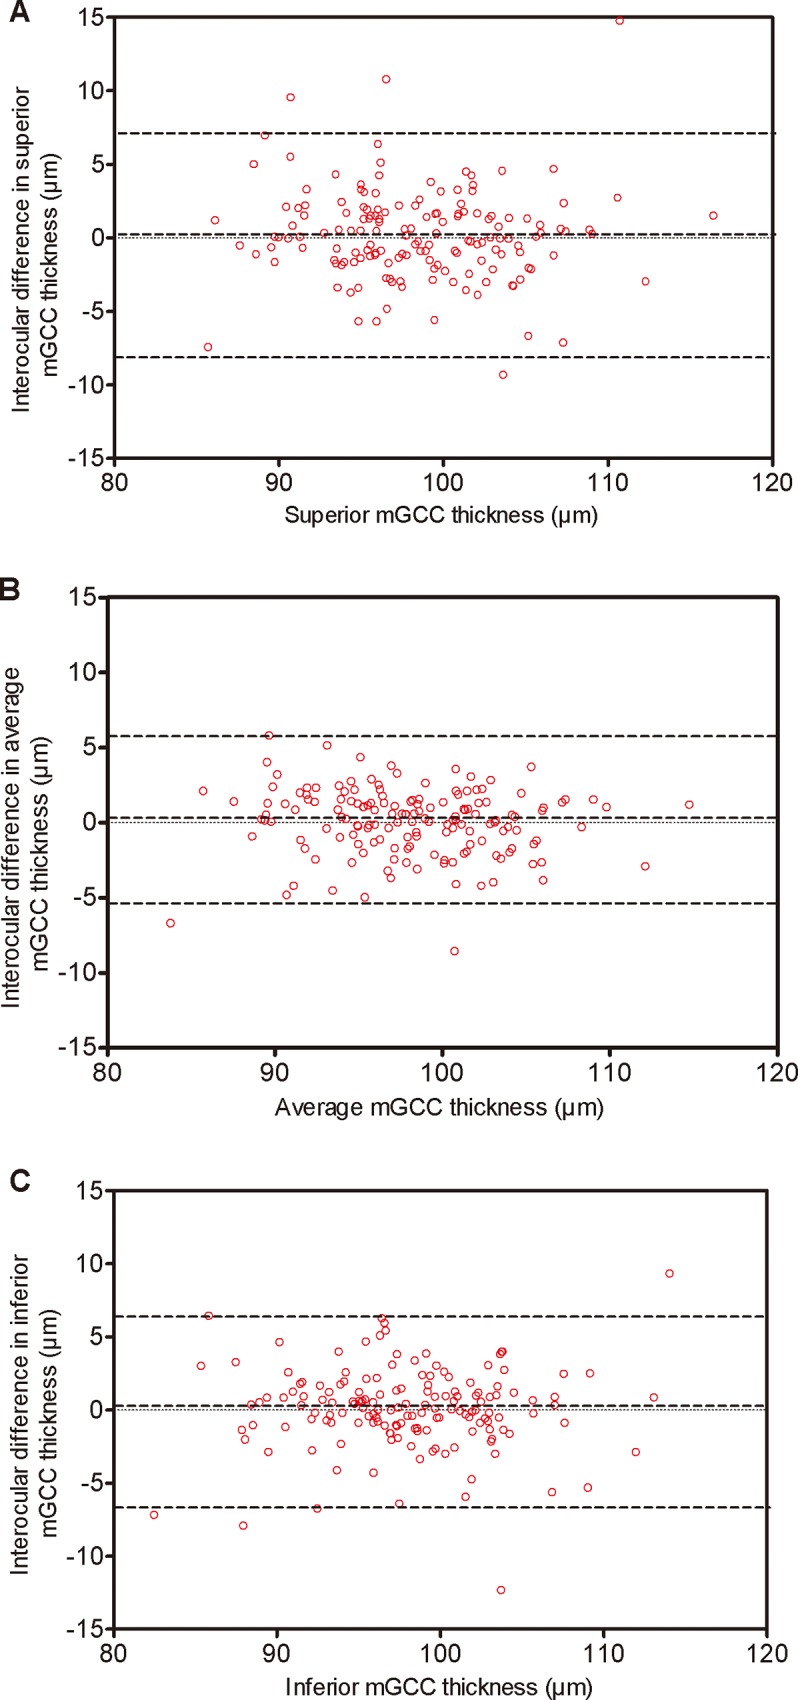
Fig 3. Bland–Altman plots for mGCC thickness of each eye.

Dotted lines delineate 95% confidence limits of agreement. There was no specific tendency to cause the difference between right and left eyes. A: superior mGCC thickness. B: average mGCC thickness. C: inferior mGCC thickness.
