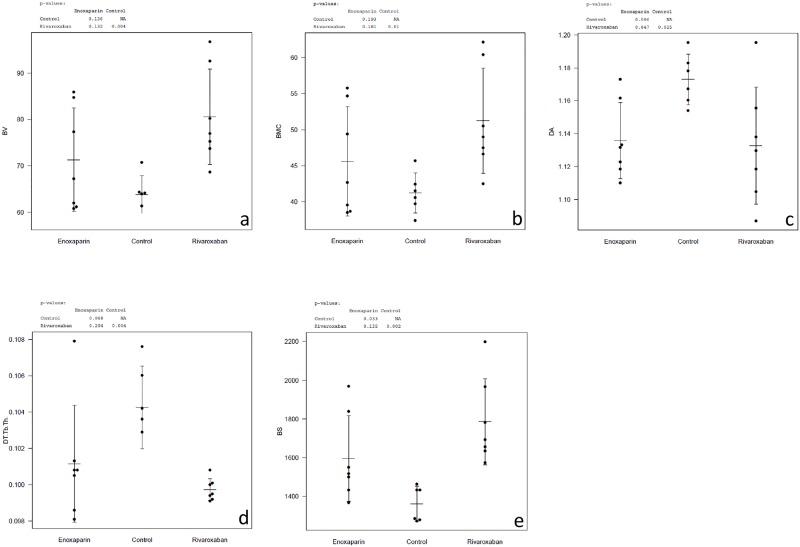
Fig 6. Summary Micro-CT Scan.
Micro-CT based assessment of histomorphometry, black points indicate exact data, grey arbour mean data ± standard deviation. (a) Bone Volume BV (mm³) = mineralized callus volume: Significant difference of Rivaroxaban compared to control group (p = 0,004). (b) Bone Mineral Content = BMC defined as callus BV multiplied by TMD (mg hydroxyapatite/ ccm): Significant difference of Rivaroxaban compared to control group (p < 0,05). (c) Degree of Anisotropy = DA: Significant difference of both substances compared to control group (p < 0,05). (d) Trabecular Thickness = Tb-Th (mm): Significant difference of Rivaroxaban compared to control group (p < 0,05). (e) Bone Surface = BS (mm²): Significant difference of both substances compared to control group (p < 0, 05).

