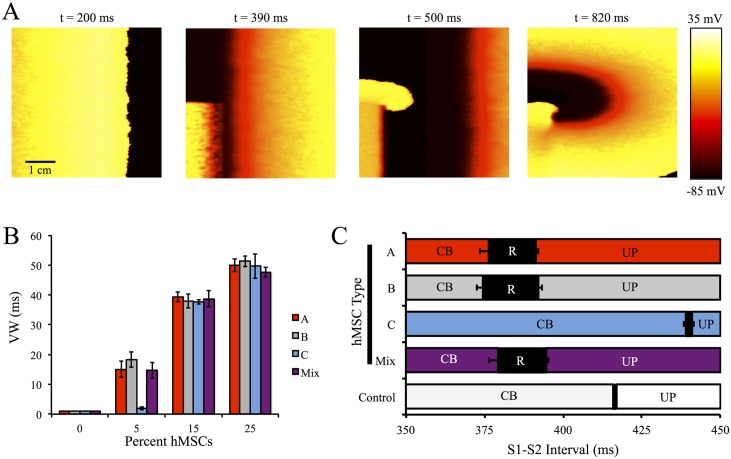
Fig 9. VW Analysis on Cardiac Tissue With Randomly Inserted hMSCs.
A VW analysis was performed to better understand the pro-arrhythmic potential of hMSC insertion in cardiac tissue. (A) Selected frames from a representative simulation of an S1–S2 interval of 380 ms that led to re-entry with 25% Type A hMSC random insertion into 2-D cardiac tissue. (B) The VWs for tissues with 0% (control), 5%, 15%, and 25% random insertion of hMSCs; at low levels of hMSC insertion, Type C hMSCs lead to the smallest increase in VW compared to control. (C) Analysis of S1–S2 intervals leading to conduction block (CB), re-entry (R), or uninterrupted propagation (UP) with 5% hMSC insertion. Error bars represent standard deviation based on three tissue configurations per condition.

