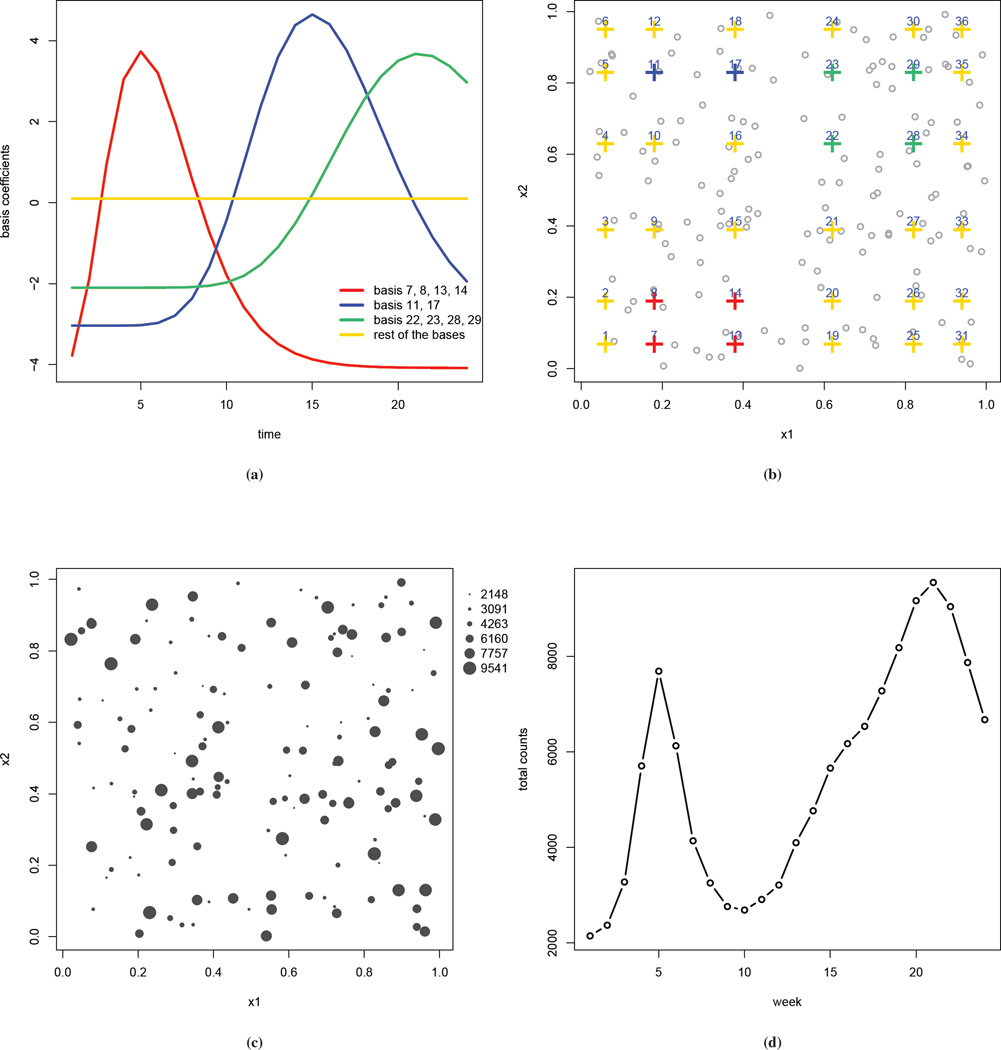
Figure 2.
Simulated Data: (a) true values of the basis functions bkt versus time; (b) locations of the basis coefficients, color coded as in (a); the grey dots are the locations of the observed counts; (c) number of cases aggregated over time (with the size of the circles being proportional to the number of cases); (d) number of cases, aggregated over space, plotted by week.

