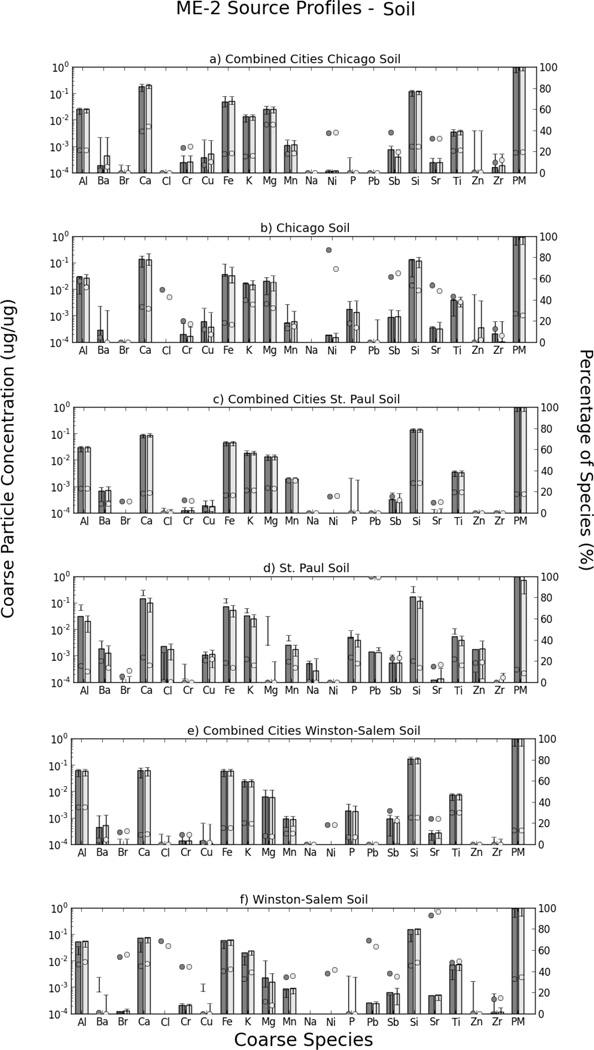
Figure 4.
PMF-derived features identified as soil. The black bars represent the average species contributions for the unconstrained models and the white bars represent the models with prior source profile constraints (see Table 1 and text). The bootstrapped 95% confidence limits are also shown. The circles refer to the percent of the total predicted concentration for a given species associated with that feature for the unconstrained (closed circles) and constrained (open circles) models. The predictions from the combined cities model (a, c, e) are shown by city along with the relevant predictions from the individual city models (b,d, f)

