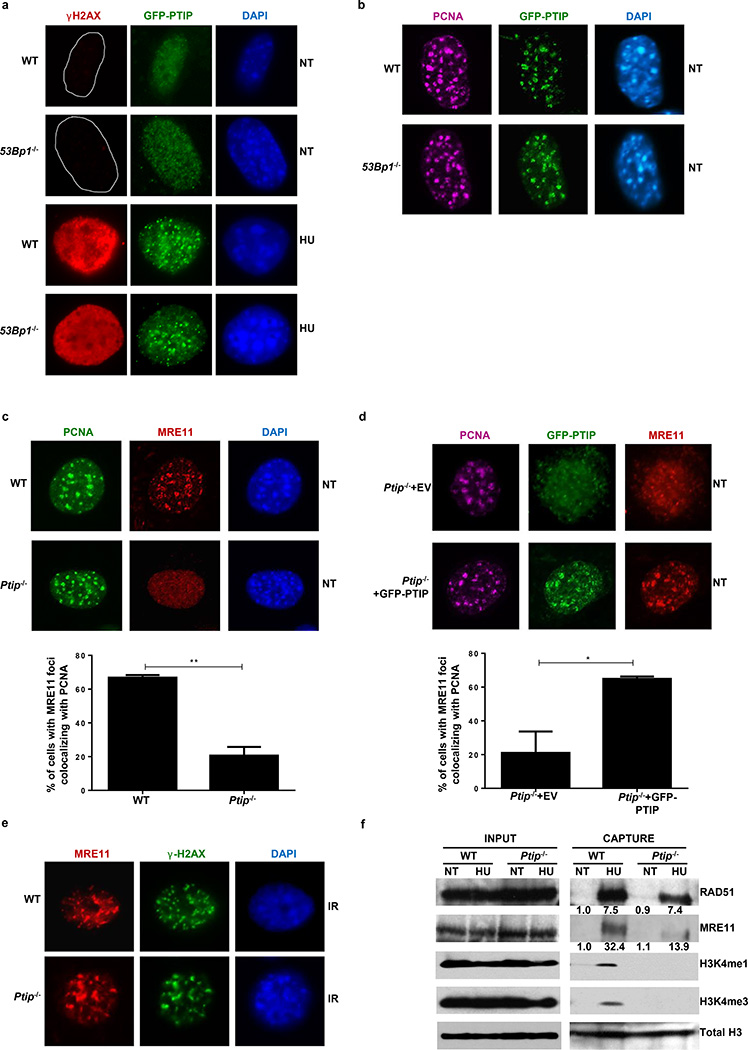
Figure 3. PTIP localizes to sites of replication and recruits MRE11 to active and stalled replication forks.
(a) WT and 53Bp1−/− MEFs expressing GFP-tagged PTIP were either treated or not (NT) with 4 mM HU and assessed for γ-H2AX (red) and PTIP (green). DAPI indicated in blue. Quantitation in Extended Data Fig. 5c. (b) Co-localization of PCNA (magenta) and PTIP (green). Quantitation in Extended Data Fig. 5d. (c) Co-localization of PCNA (green) and MRE11 (red). Quantitation in lower panel (n=150 cells examined). (d) Ptip−/− MEFs infected with either empty vector (EV, containing IRES-GFP) or full-length PTIP (FL) and probed for GFP (green), MRE11 (red), and PCNA (magenta). Quantitation in lower panel (n=150 cells examined). (e) MRE11 (red) and γ-H2AX (green) IR-induced foci. Quantitation in Extended Data Fig. 5g. (f) iPOND analyses of proteins at replication forks (capture). Input represents 0.25% of the total cellular protein content. RAD51 and MRE11 levels (shown below) were normalized to total H3. Experiments were repeated 3 times.

