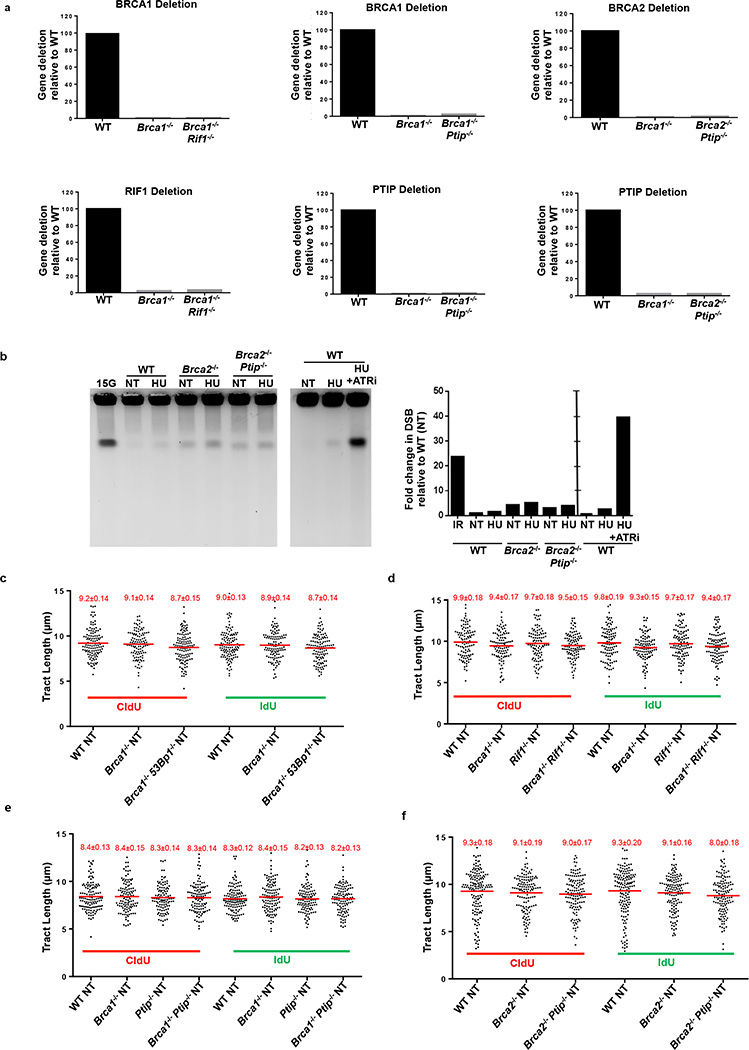
Extended Data Fig. 2. Replication fork progression rates and DSBs in B lymphocytes.
(a) Quantitative PCR analysis for Brca1, Brca2, Ptip and Rif1 gene deletions in WT, Brca1−/−, Brca1−/− Rif1−/−, Brca1−/−Ptip−/−, Brca2−/− and Brca2−/− Ptip−/− primary B lymphocytes after infection with CRE. (b) PFGE analysis for detection of DSBs in WT, Brca2−/− and Brca2−/− Ptip−/− B lymphocytes treated with or without 4 mM HU for 3 hr. Positive control for DSBs includes treatment of 15 Gy IR and HU +ATRi treatment for 3 hr. Quantification of -fold change in DSBs across genotypes relative to non-treated WT is plotted on the right. (c-f) Replication fork progression rates measured by tract lengths in µM of CldU (red) and IdU (green) in WT, Brca1−/−, Brca1−/− 53Bp1−/−, Rif1−/−, Brca1−/−Rif1−/−, Ptip−/−, Brca1−/− Ptip−/−, Brca2−/− and Brca2−/− Ptip−/− primary B lymphocytes. Samples were not treated with HU. Numbers in red indicate the mean and standard deviation for each sample. 125 replication forks were analyzed for each genotype.

