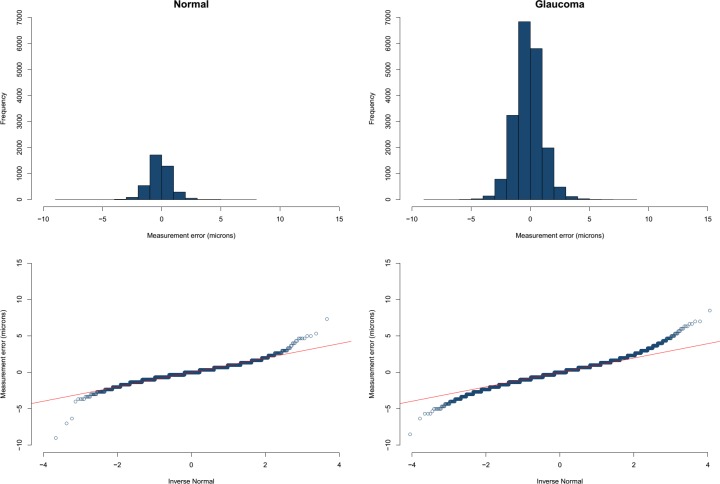
Figure 3.
Top: histogram demonstrating the distribution of measurement errors for the IPL in the healthy (A), and glaucoma (B) groups. The distributions are quite normal except for a small number of outliers toward both tails of the distribution. Bottom: the normal quantile plots for the same layer and groups demonstrating the small tails of outliers in superpixel thickness data starting at approximately a z score of 3.

