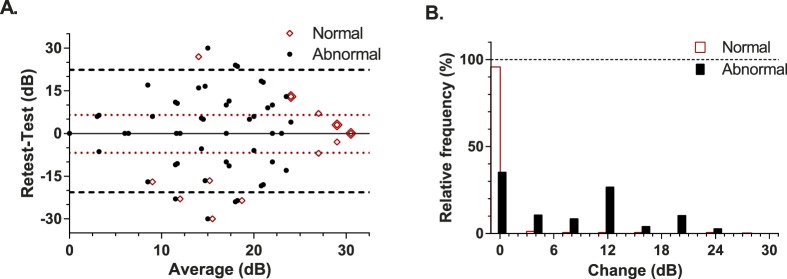
Figure 8.
Test-retest performance in our participants. (A) Bland-Altman analysis with the red unfilled diamonds showing normal variability and the horizontal dotted lines giving the 95% LoA for these data. As many points are superimposed on a common location these locations have been indicated by the large diamond overlay. The filled circles show the retest variability at abnormal locations (<25 dB) in the presence of a simulated scotoma. The horizontal dashed lines mark the 95% LoA for these abnormal data. Data have been jittered along the x axis for clarity. (B) The frequency of different amounts of change encountered at retest plotted for normal (unfilled bars) and regions of simulated scotoma (filled bars). Frequency has been expressed as a percentage of the total test point population.

