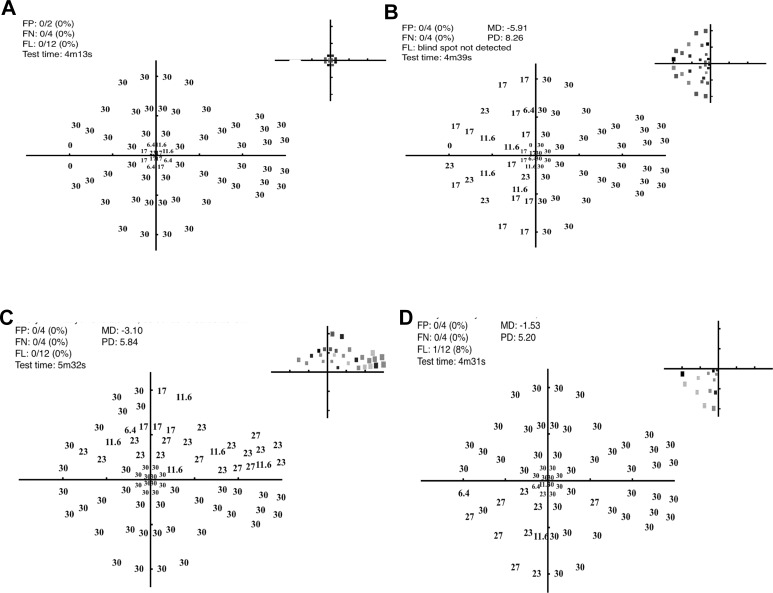
Figure 9.
Representative thresholds (decibels and gray scale inset at top right of each panel) for one participant in the presence of four different simulated scotoma (as per Fig. 4C). (A) Central scotoma, (B) hemianopia, (C) superior arcuate defect, and (D) quadrantic defect. The gray scale plots in the top right corner of each plot code the abnormal locations based upon the normal probability of Figure 8B.

