Fig. 4.
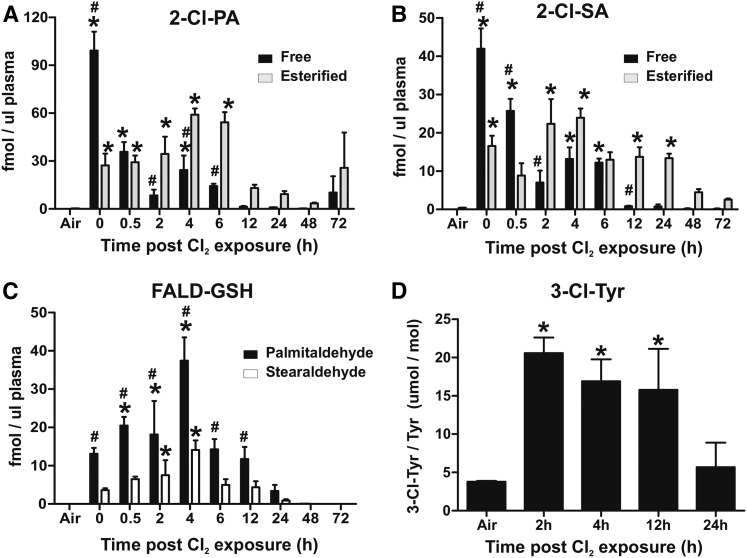
Cl2 gas exposure increases chlorinated fatty acids, GSH-fattyaldehyde adducts, and chlorotyrosine in the circulation. C57bl/6 mice were exposed to Cl2 gas (400 ppm, 30 min) and then brought back to room air. At the indicated times thereafter, plasma was collected and free (black bars) and esterified (gray bars) 2-Cl-PA (A) and 2-Cl-SA (B) were measured. Air indicates basal or air-exposed mice. Time point 0 indicates immediately post-Cl2 exposure. Data shown are mean ± SEM, n = 3–4 (except 72 h, n = 2). *P < 0.05 by one-way ANOVA with Dunnett’s multiple comparison post test relative to air. #P < 0.05 by two-way repeated measures-ANOVA with Bonferroni post test comparing free and esterified levels at each time. C: GSH adducts with palmitaldehyde (black bars) and stearaldehyde (open bars) in the plasma. Data shown are mean ± SEM, n = 3–4 (except 72 h, n = 2). *P < 0.05 by one-way ANOVA with Dunnett’s multiple comparison post test relative to air. #P < 0.05 by two-way repeated measures-ANOVA with Bonferroni post test comparing palmitaldehyde- and stearaldehyde-GSH adducts at each time. D: The 3-Cl-Tyr levels normalized to total tyrosine in plasma. Maximum values at 2 h correspond to 0.1 ± 0.01 pmol/μl plasma. All data are mean ± SEM, n = 3–4. *P < 0.05 by one-way ANOVA with Dunnett’s multiple comparison post test relative to air.

