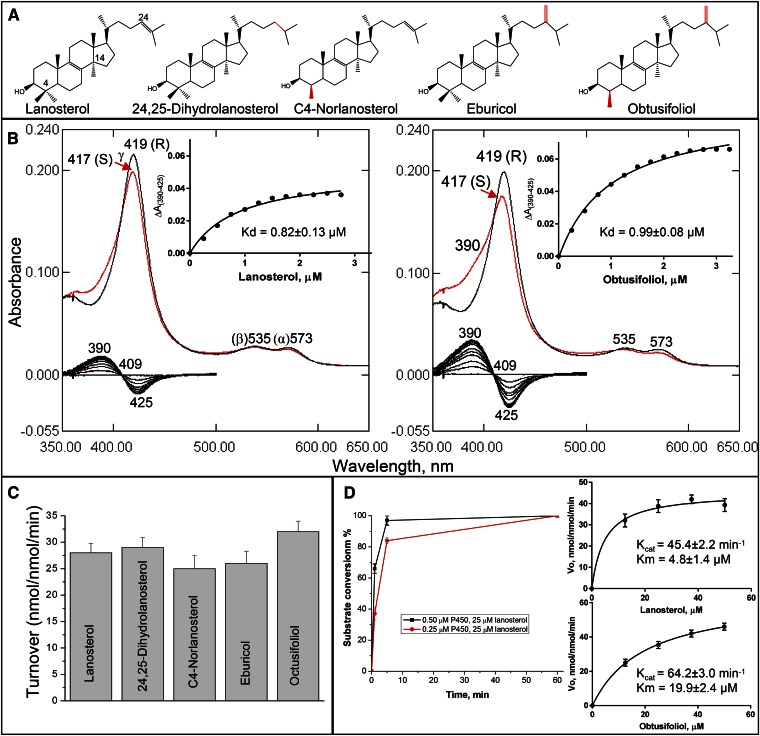
Fig. 1.
Substrate binding and catalysis by human CYP51. A: CYP51 substrates: structural differences (relatively to lanosterol) are marked in red. B: Spectral response of human CYP51 to lanosterol and obtusifoliol. P450 concentration ∼1.7 μM, optical pathlength 1 cm. Absolute (top) and difference (bottom) absorbance spectra. The low-to-high spin transitions (saturation with lanosterol and obtusifoliol) were 18 and 36%, respectively. Titration curves are presented in the insets; the corresponding calculated binding parameters are given in Table 2. C: Experimental catalytic turnovers of human CYP51 at 0.5 μM P450 and 50 μM sterol substrate, 1 min reaction. D: Time course with 0.5 and 0.25 μM P450 and Michaelis-Menten plots at 0.25 μM P450 (1 min reaction); see also Table 3.

