Fig. 5.
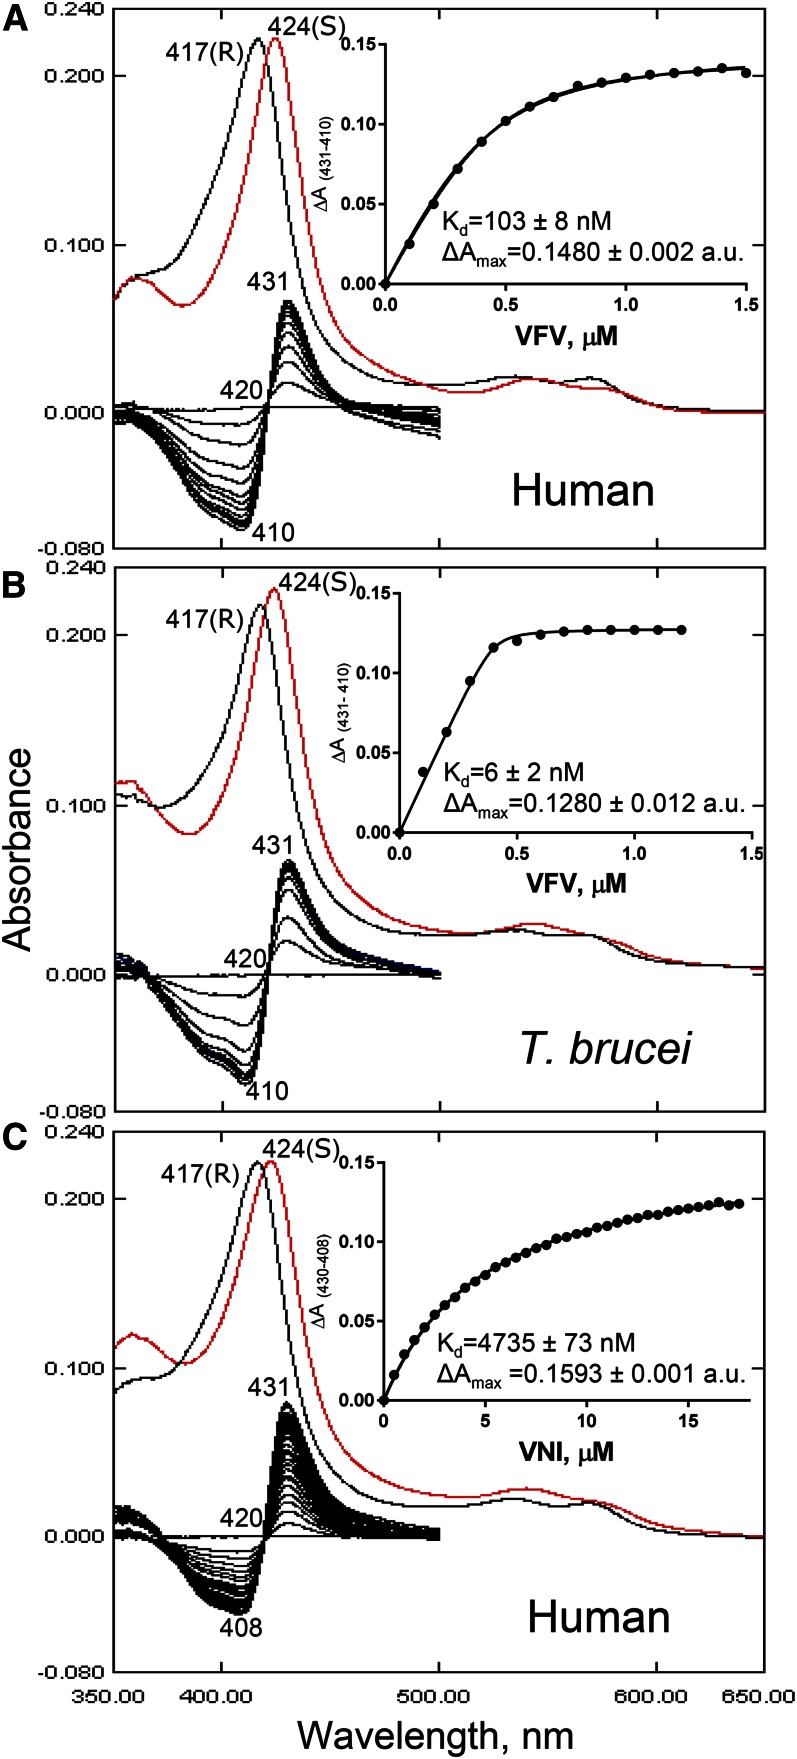
CYP51 spectral response to the addition of heme-coordinating inhibitors. A: Human CYP51-VFV. Absolute (top) and difference (bottom) absorbance spectra. The wavelengths of the Soret band maxima for the peak, isosbestic point, and trough in the difference absorbance are marked, along with the peaks in the absolute spectra. S, sample (after saturation with the inhibitor, red curve): R, reference (difference spectra made by subtracting R from S). Each titration curve is presented in the inset. The shapes of the curves are not sigmoidal, indicating that binding of the second VFV molecule is not reflected in the P450 spectral response. Spectral responses of T. brucei CYP51 to VFV [1:1 stoichiometry of the complex (PDB ID 4G7G)] (B) and human CYP51 to VNI (C) are presented for the comparison. The corresponding calculated Kd values are given (see also Fig. 2). The P450 concentration was ∼0.4 μM, and the optical path length was 5 cm.

