. 2016 Jun 9;5:e16950. doi: 10.7554/eLife.16950

Figure 4. Dynamic organellar maps reveal protein localization changes following EGF stimulation.

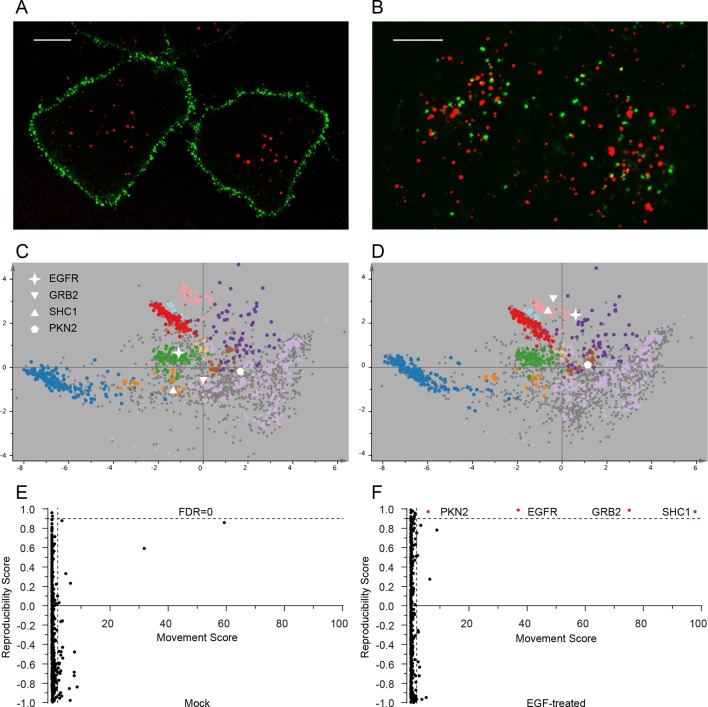
(A, B) Fluorescently tagged EGF (green) was pre-bound to HeLa cells on ice, and imaged by confocal microscopy. Lysosomal compartments were visualized with Lysotracker (red). Most of the EGF was at the cell surface (A). Cells were then shifted to 37°C, and incubated for 30 min. EGF had been cleared off the cell surface, and localized predominantly to an endosomal compartment, with little lysosomal co-localization (B). Scale bars = 10 μm. (C) Organellar maps were prepared from untreated HeLa cells, and (D) from cells following 20 min of continuous stimulation with 20 ng/ml EGF. The translocation of the EGFR receptor (star symbol) from plasma membrane to endosomes was captured. Colours indicate organelles as in Figure 2. Maps show the combined data from three replicates each. (E, F) Unbiased identification of significant translocation events triggered by EGF stimulation. Each protein is scored for magnitude of translocation (M score, x-axis) and reproducibility of translocation direction (R score, y-axis) across the three replicates. A MR plot reveals significant translocations in the top right quadrant. Score cut-offs for FDR-control were determined by analysis of a triplicate mock experiment where no genuine translocations are expected (E). Ultra-stringent cut-offs (corresponding to an FDR of 0) were then applied to the EGF treatment experiment (F). Four significant translocations were detected, including EGFR and two known binding partners, GRB2 and SHC1. As the maps in C, D reveal, all move to the endolysosomal cluster. Figure 4—figure supplement 1 provides a schematic of the experimental design. Please refer to Figure 4—figure supplements 2 and 3 for further in-depth analysis of protein localization changes following EGF stimulation.

DOI: http://dx.doi.org/10.7554/eLife.16950.010

Figure 4.

Figure 4—figure supplement 1. Dynamic organellar maps (EGF-treatment) – overview of the experimental workflow.

Figure 4—figure supplement 1.

Starting with SILAC light and heavy cells in both conditions, lyse each batch of cells separately. Subject the lysates to differential centrifugation, generating membrane sub-fractions with light lysate and global fractions with heavy lysate. To identify moving proteins with precise location (follow grey lines), mix light fractions 1:1 with global membrane fraction of identically treated cells, to obtain ratios, which are visualised in PCA space. Weight SILAC L/H ratios by protein amount in the light fraction. Subtract equivalent weighted ratios of the untreated samples from the treated samples to obtain a difference profile of five differences for each protein. Repeat this three times, apply statistical test to identify moving proteins (MR plot). Use SVM-based machine learning to identify the new location of proteins that have moved. To identify proteins moving within the global membrane, nuclear and cytosolic fractions (red lines), measure the heavy fractions and quantify using MaxLFQ (Cox et al., 2014). Perform a T-test on triplicate data to reveal protein abundance changes in the global fractions. For copy number changes (green lines), multiply the intensity data by the protein yields, and use the sum of these values in the proteomic ruler (Wisniewski et al., 2014) to obtain total copy numbers. Multiply the copy numbers by the change in the proportion of a protein in a global fraction to obtain copy numbers entering or leaving this fraction.
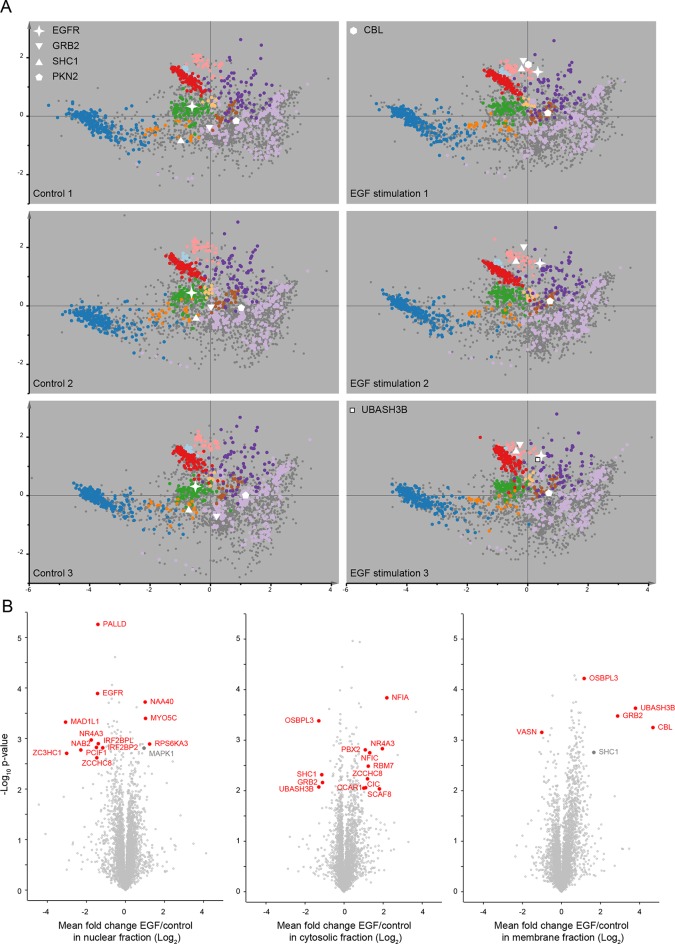
Figure 4—figure supplement 2. Protein localization changes following EGF stimulation.

Figure 4—figure supplement 2.

(A) Organellar maps were prepared from untreatedHeLa cells (control, left side), and from cells following continuous stimulation with EGF for 20 min (+EGF, right side). The individual maps from triplicate biological repeats are shown, visualized by PCA. Organellar clusters are colour coded as in Figure 2. Major translocating proteins are shown as unique symbols. CBL and UBASH3B were identified in only one of the +EGF maps; they are mostly cytosolic before EGF treatment, and hence not identified in control maps. (B) Detection of EGF-induced global profile changes. Nuclear, membrane and cytosolic fractions from the experiments described in A) were subjected to mass-spectrometric analysis using label-free quantification (LFQ). Mean Log2 LFQ values from triplicate control experiments were subtracted from triplicate EGF stimulation experiments and plotted against Student’s (two-sided) t-test p-value for that difference (a ‘volcano’ plot). Proteins that increase in abundance in the relevant compartment following EGF stimulation are found on the right-hand side of the plots. Proteins undergoing significant translocations are shown in red, based on cut-offs determined as follows. First, the protein must show a minimum two-fold change in abundance (absolute log-difference >1). Second, the protein must constitute at least 10% of the total pool, either before or after EGF stimulation, in the compartment where it is shown to be changing (as determined from the protein’s global intensity profile; see Figure 1A). Finally, the p-value cut-off was FDR-controlled using the six control maps generated in Figure 2—figure supplement 2A as a mock experiment, in which no true positives would be expected. Three maps were assigned as mock-treated, three as control. For each compartment, a p-value cut-off was chosen such that no false positives would be detected in the mock experiment, but changes could still be detected in the genuine experiment (FDR = 0). This was possible for cytosolic and membrane fractions (-log10 p=2.0 and 3.1, respectively). In the case of the nucleus (-log10 p=2.6), two false positives are expected among the 13 positives (FDR ≈ 15%). Two relevant changes (shown in grey) narrowly missed significance with our extremely stringent cut-offs (SHC1 in the organellar fraction, and MAPK1 in the nuclear fraction). While their p-values were sufficiently high to reach significance, their fold-changes were just below two.
Figure 4—figure supplement 3. Global protein distribution profile changes induced by EGF treatment.

Figure 4—figure supplement 3.

For proteins undergoing significant localization changes (Figure 4—figure supplement 1, Supplementary file 7), the distribution between nuclear, organellar and cytosolic fractions is shown before and after EGF treatment (bars show mean ± SD, n=3). Many proteins show transitions between nuclear and cytosolic fractions (eg CIC, NAA40). Several are recruited to the organellar fraction, from the cytosolic pool (eg CBL, GRB2, and SHC1). VASN shows overall degradation. Please refer to the Methods for full details on the interpretation of global distribution profiles and their changes. Furthermore, note that in each case, the three control fractions are normalized to a sum of 1. If EGF treatment changes the overall abundance of a protein, the sum of the three +EGF fractions will be different from 1 (eg <1, if the protein is degraded).