
Figure 4. Targets of immune intervention in type 1 diabetes.
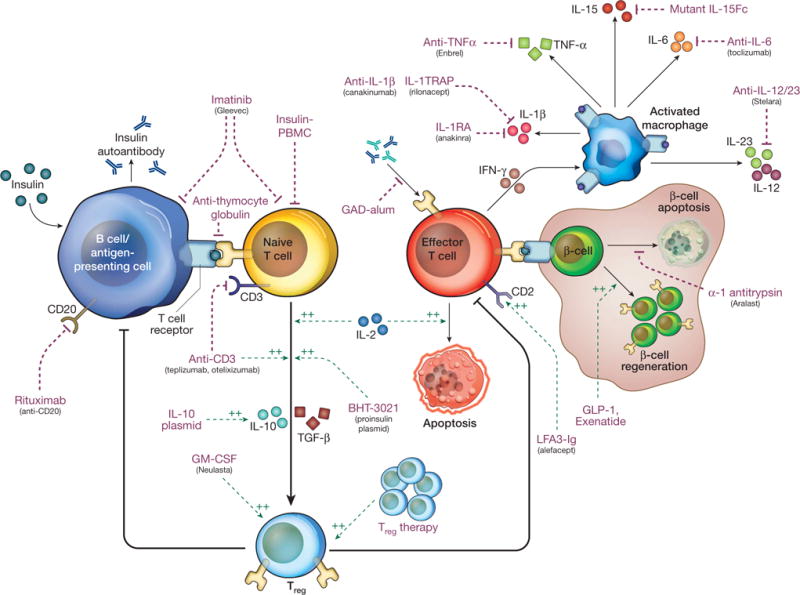
This schematic provides an overview of the pathogenesis of type 1 diabetes, highlighting a number of key pathways that are being targeted by current therapeutics. Although not exhaustive (see Supplementary Table 1), this figure shows that both non-specific and antigen-specific therapies are being tested, which inhibit effector cells and antigen presentation as well as boost regulatory pathways. Purple and green dotted arrows indicate the therapeutics, black arrows are immune and metabolic pathways; a green dotted arrow indicates a positive effect and a purple dotted arrow indicates a negative effect. In addition, these immunotherapies are being combined with drugs that promote β-cell survival to potentially replenish insulin-producing β-cells. The figure has been redrawn after ref. 87, with permission.