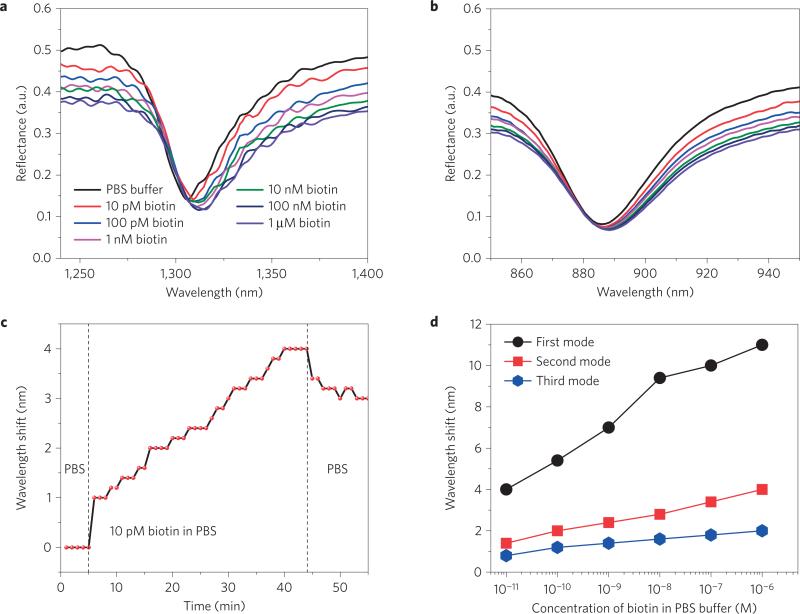
Figure 3. Evaluation of sensor performance using lower-molecular-weight biomolecules.
a,b, Reflectance spectra of the sensor device for different concentrations (10 pM to 1 μM) of biotin in PBS for the first mode (a) and the second mode (b). c, The variation of wavelength shift in the presence of 10 pM biotin in PBS over time. The wavelength spectroscopic resolution is set to 0.2 nm. The wavelength shift shows a distinct red shift over time. d, The variation of wavelength shift for three modes with different concentrations of biotin in PBS. The size of the data points in d represents the error bar.

