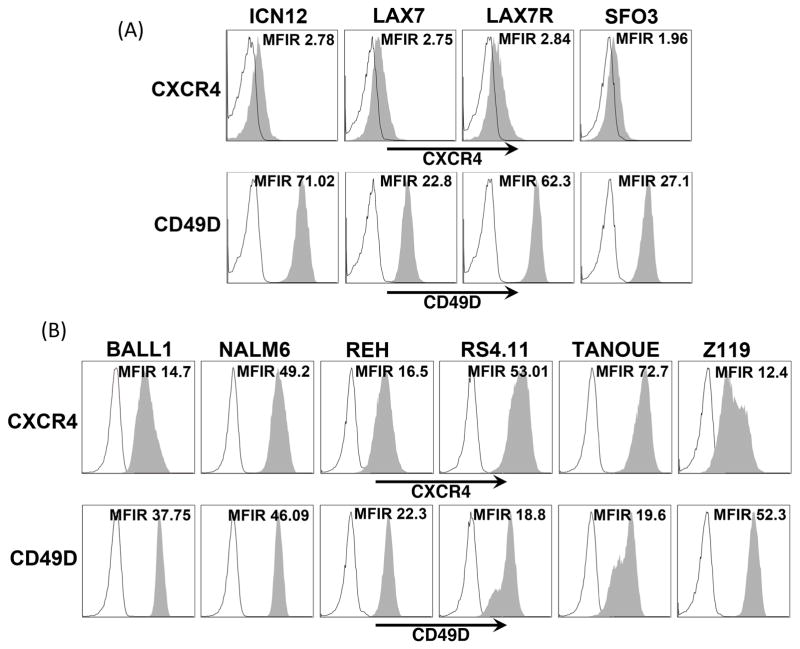
Figure 1. Expression of CXCR4 and CD49D in various ALL cell lines and xenograft cells.
Histograms show Mean Fluorescent Intensity Ratio (MFIR) of CXCR4 and CD49D (grey peaks) as compared to their respective isotype controls (black outlined peaks) in different B-ALL cell lines (A) and xenografts (B). Mean Fluorescent Intensity Ratio (MFIR) is shown individually for each histogram.

