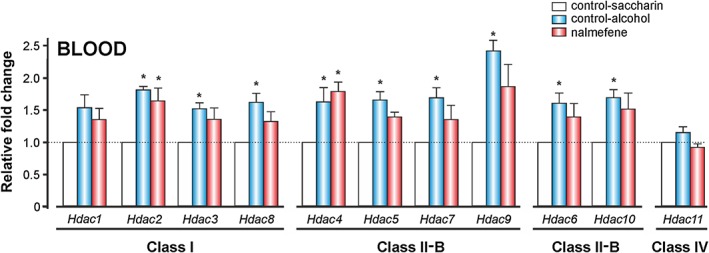
Figure 8.

The effects of alcohol and nalmefene on Hdac gene expression in peripheral blood in vivo. The animals were treated with alcohol and nalmefene as described in Figure 6. Blood samples from the rat tail vein were collected in vivo immediately after alcohol self‐administration. Data represent the mean ± SEM (n = 9, 8, 7 per group) of the relative fold change obtained using the 2ΔCt method. * P ≤ 0.004 compared with the control‐saccharin group.
