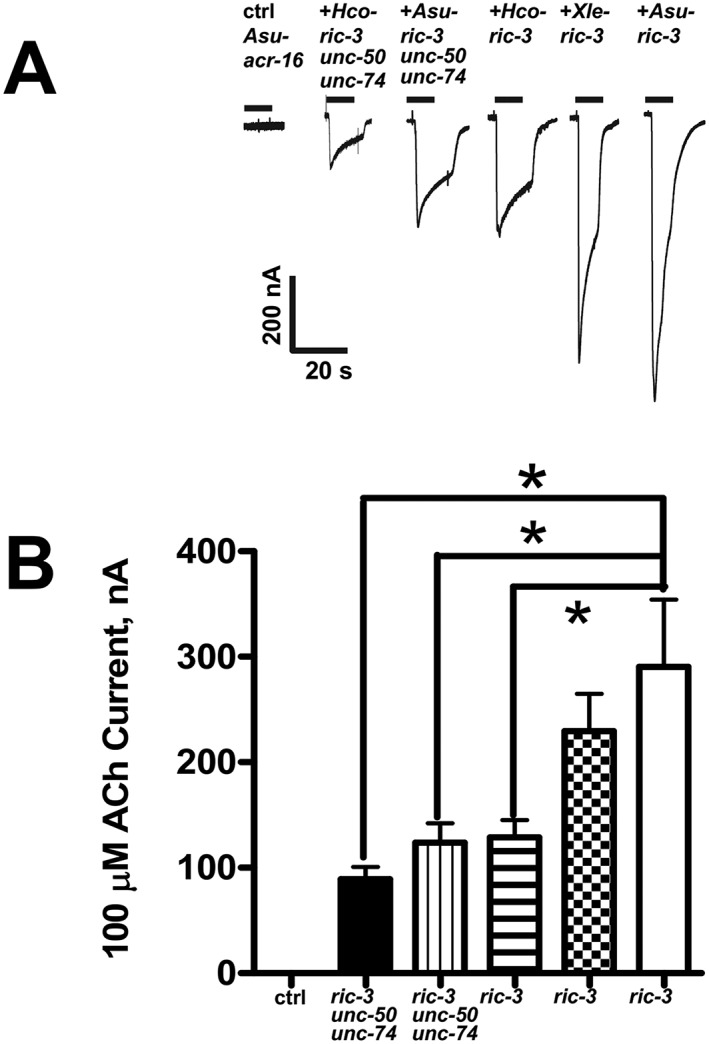
Figure 3.

Effects of the ancillary proteins, RIC‐3, UNC‐50 and UNC‐74, from different nematode species, on Asu‐ACR‐16 expression. (A) Sample traces represented as inward currents produced in response to 100 μM ACh. (B) Bar chart (mean ± SEM) showing (left to right) current (in nA) generated in response to 100 μM ACh produced. Control (ctrl): Asu‐acr‐16 alone (n = 21). Black bar: Asu‐acr‐16 plus Hco ‐ric‐3, unc‐50 and unc‐74 (n = 15). Vertical line fill: Asu‐acr‐16 plus Asu ric‐3, unc‐50 and unc‐74 (n = 15). Horizontal line fill: Asu‐acr‐16 plus Hco ‐ric‐3 (n = 17). Checkered fill: Asu‐acr‐16 plus Xle ‐ric‐3 (n = 20). No fill: Asu‐acr‐16 plus Asu‐ric‐3 (n = 23). Asu‐acr‐16 on its own did not respond to ACh, and the largest current size was obtained when Asu‐acr‐16 was co‐injected with Asu‐ric‐3. * P < 0.05; significantly different as indicated; Tukey's multiple comparison tests.
