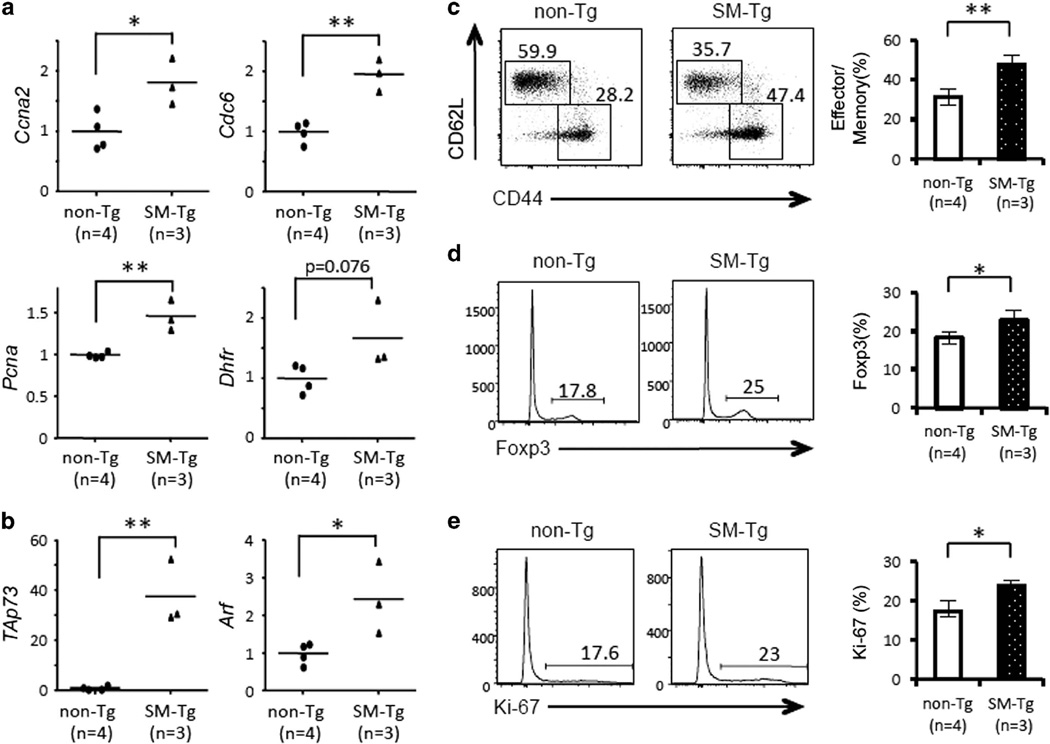
Figure 6.
CD4+ T cells of SM-Tg mice show activation of the E2f pathway. The expression of E2F-1 target genes related to the cell cycle (a) and apoptosis (b) in CD4+ T cells from non-Tg (n=4) or SM-Tg (n=3) mice was analyzed by qPCR. Each symbol represents an individual mouse. The horizontal lines indicate mean values. (c) Representative dot plots of CD44 and CD62L expression in CD4+ T cells from non-Tg (n=4) and SM-Tg (n=3) mice (left) and mean percent of CD4+ T cells that are effector/memory T cells (CD44+CD62L−) (right). (d) Representative histograms of Foxp3 expression in CD4+ T cells from non-Tg (n=4) and SM-Tg (n=3) mice (left) and mean results (right). (e) Representative histograms of Ki-67 expression in CD4+ T cells from non-Tg (n=4) and SM-Tg (n=3) mice (left) and mean results (right). Statistical significance was determined by the two-tailed paired Student's t-test. Asterisks indicate the statistical significance as follows: *P < 0.05; **P < 0.01.

