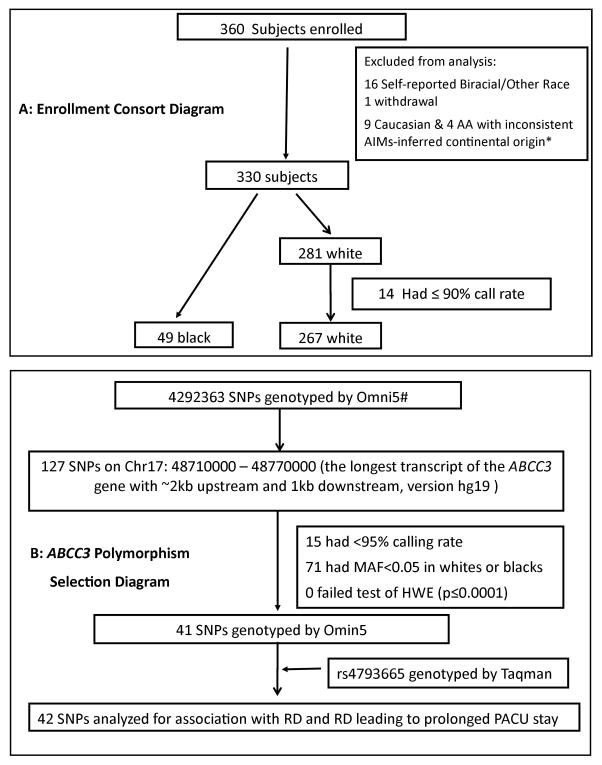
Figure 1. A. Enrollment consort diagram.
illustrates the flow of enrolled study participants through this clinical trial. Reasons for exclusions, enrolled and analyzed patients are reported. * Principal Component Analysis using 218 Ancestry Information Markers was done (explained in reference (7)), using Hapmap population as the reference group and principal components PC2 vs. PC1 were plotted (not shown here). The selection of subjects that did not cluster well– 9 Caucasian and 4 African American (AA) were thus excluded. B: ABCC3 Polymorphism Selection Diagram illustrates the selection of polymorphisms based on genome wide and Taqman genotyping for inclusion in genetic association analysis. SNP=Single nucleotide polymorphism. #Illumina Human OMNI-5 genotyping array using the iScan System (Illumina) and Infinium2 chemistry. RD: Respiratory depression; PACU: Postoperative Anesthesia Care Unit; SNPs: Single Nucleotide Polymorphisms

