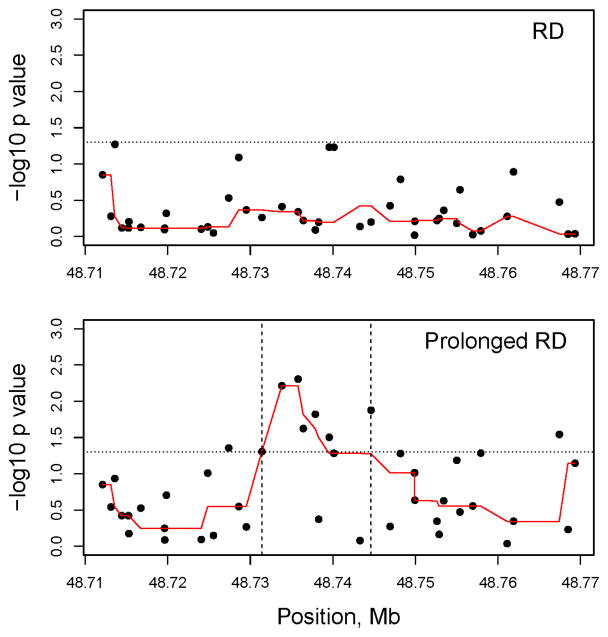
Figure 2. Genetic association of 42 ABCC3 polymorphisms and clinical outcomes: Respiratory Depression (RD) – top panel and Prolonged Postoperative Care Unit (PACU) stay due to RD/Prolonged RD (lower panel).
The y axis shows the −log10 P values and the x axis shows the chromosomal positions of the ABCC3 polymorphisms (SNPs) on Chromosome 17. The −log10 (p values) of the single SNP association tested in additive models are plotted. The reference line (small dots) shows the −log10 (p value of 0.05) level. In both races consistently several ABCC3 SNPs between the vertical lines (region between 48731392 to 48744612 bp) showed significant association with prolonged PACU stay due to respiratory depression. The p-values were smoothed using a running median represented by the red line in both plots.

