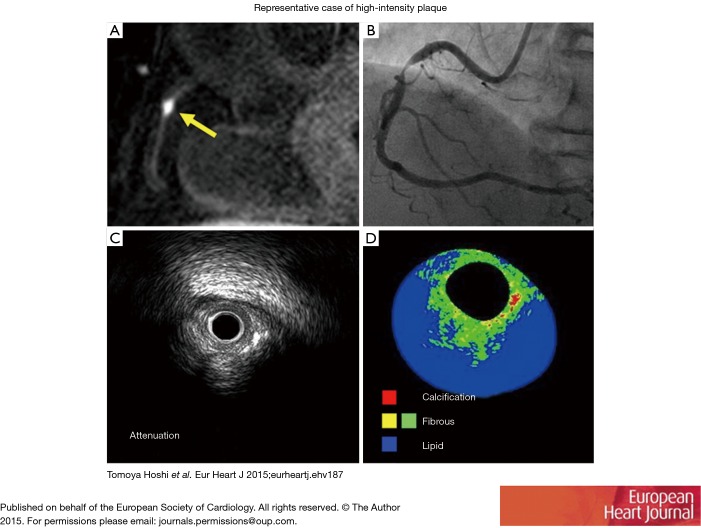
Figure 2.
Characteristics of high risk plaque. (A) T1-weighted magnetic resonance imaging of high-signal intensity of the right coronary artery with a plaque to myocardium signal intensity ratio of 3.09 (yellow arrow indicates lesion); (B) a coronary angiogram showing severe stenosis in the proximal portion of the right coronary artery; (C) gray-scale intravascular ultrasound image showing ultrasound attenuation; (D) integrated backscatter intravascular ultrasound showing lipid-rich plaque (blue area). Reprint from Hoshi et al. (52). Reproduced with permission of the publisher. Copyright © 2015, Oxford University Press.

