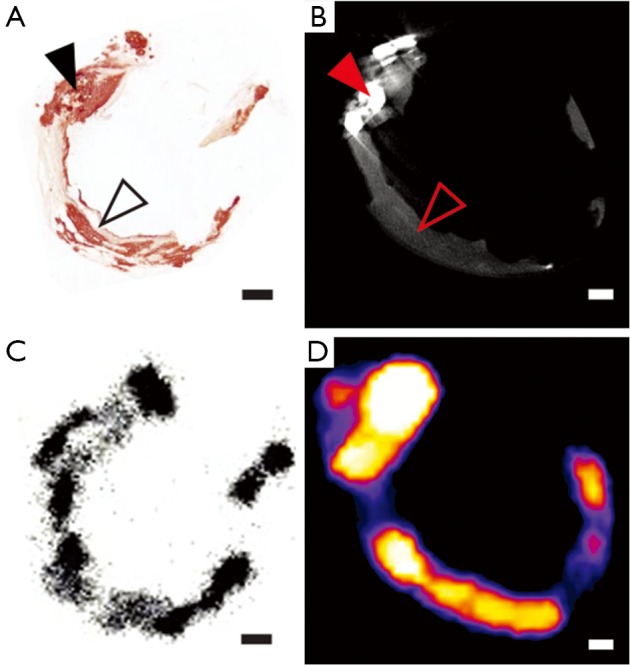
Figure 2.

Sections showing macrocalcification (solid arrow) and microcalcification (hollow arrow) in: (A) histology section with Alizarin Red staining; (B) micro CT; (C) autoradiography; (D) 18F-NaF microPET. Adapted from original publication in Nature Communications “Identifying active vascular microcalcification by 18F-sodium fluoride positron emission tomography.” Irkle A, Vesey AT, Lewis DY, et al. Nat Commun 2015;6:7495. Licensed under CC BY 4.0. PET, positron emission tomography; CT, computed tomography.
