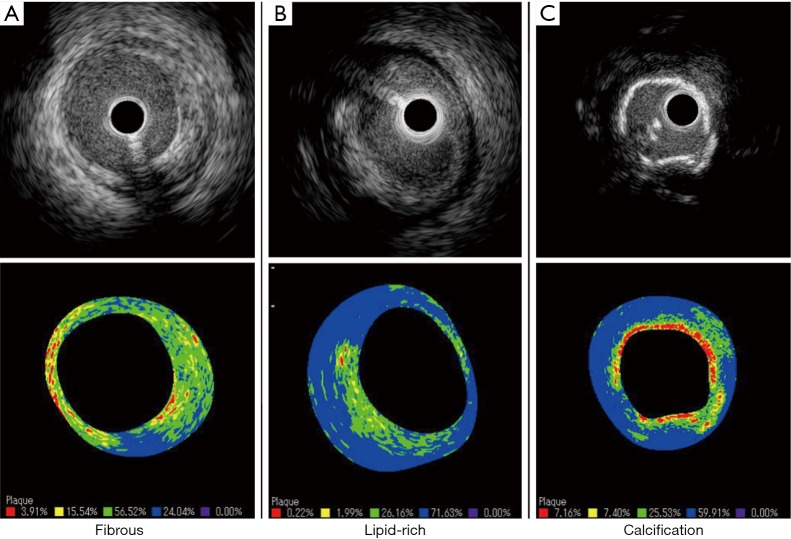
Figure 3.
Images of plaque phenotype on IB-IVUS. Upper panels show grayscale IVUS images while lower panels show corresponding IB-IVUS images. (A) Fibrous plaque; grayscale IVUS shows high echogenic plaque between 12 to 8 o’clock. IB-IVUS image shows that most of plaque is classified into fibrous tissue (green and yellow); (B) lipid-rich plaque: graysclae IVUS image shows attenuated plaque between 6 to 12 o’clock. IB-IVUS image shows that most of plaque is classified into lipid-rich tissue (blue); (C) calcification: grayscale IVUS shows superficial entire-circumference of calcification. Corresponding IB-IVUS image indicates the presence of superficial calcification (red). IB-IVUS, integrated backscatter intravascular ultrasound. IVUS, intravascular ultrasound.

