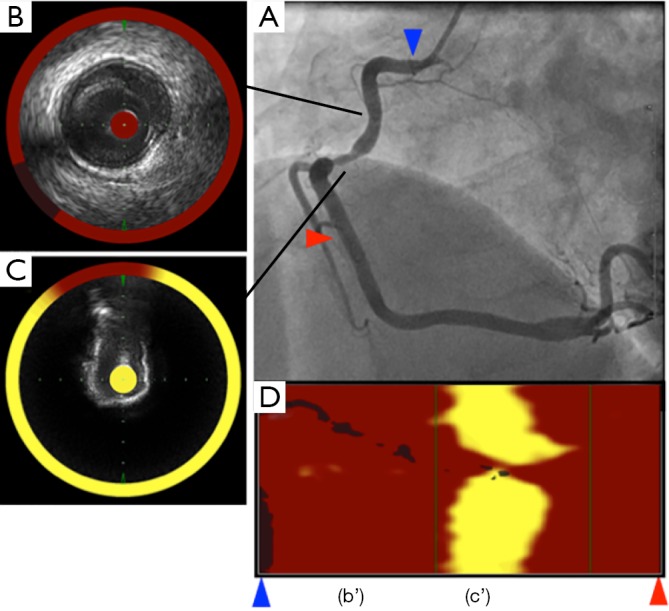
Figure 5.

Lipid core plaque in the right coronary artery detected by NIRS-IVUS. (A) Angiography showed stenosis in the mid-right coronary artery. Automated pullback was performed from mid (red arrow head) to proximal right coronary artery (blue arrow head); (B) IVUS image shows plaque between 9 to 4 o’clock. The ring around the IVUS image represents the NIRS values. High probability of lipid core plaque is displayed as yellow and low probability as red. At this lesion, NIRS indicated no lipid core plaque; (C) the cross sectional IVUS image shows with superficial calcification and resultant shadowing in the mid-right coronary artery. NIRS showed nearly circumferential lipid core plaque; (D) this figure shows “chemogram” of the right coronary artery between red arrow head and blue arrow head. (B’) Corresponds to Figure 5B lesion, while (C’) corresponds Figure 5C lesion. NIRS, near infrared spectroscopy; IVUS, intravascular ultrasound.
