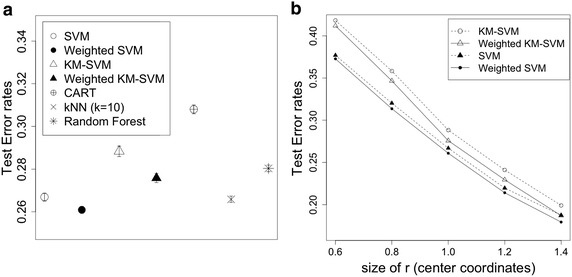
Fig. 1.

Performance comparisons across different classification rules. Each dot represents the averaged values of repeated simulations, and the bars overlaid with dots represent standard errors. a Prediction errors of six different classification rules, b decreasing patterns of test error rates as r (coordinates of centers) increases in value
