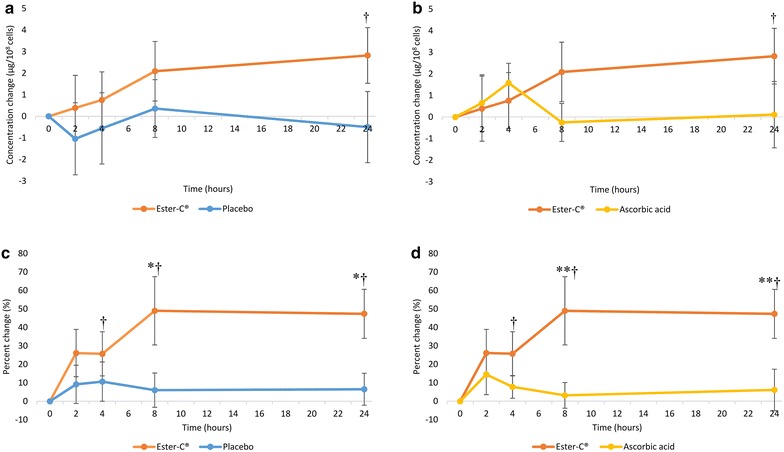
Fig. 5.

Mean vitamin C concentration and percent changes in leukocytes over a 24-h period: a concentration change, Ester-C® versus placebo; b concentration change, Ester-C® versus ascorbic acid; c percent change, Ester-C® versus placebo; d percent change, Ester-C® versus ascorbic acid. Data are mean ± standard error. Significant differences are indicated: *P < 0.05, Ester-C® versus placebo percent change (P = 0.042 at 8 h, P = 0.036 at 24 h); **P < 0.05, Ester-C® versus ascorbic acid percent change (P = 0.028 at 8 h, P = 0.034 at 24 h); †P < 0.05, Ester-C® within-group differences (concentration change P = 0.036 at 24 h; percent change P = 0.040, P = 0.013, and P = 0.001 at 4, 8, and 24 h, respectively)
