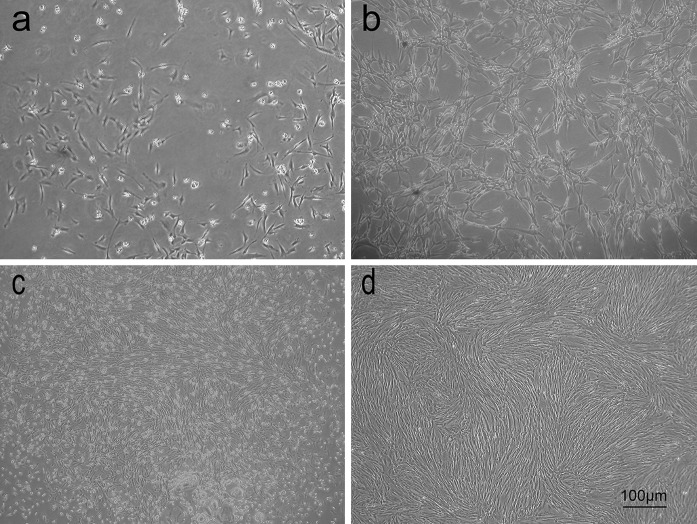
Fig. 1.
Phase-contrast images of hUCB-MSCs show morphology changes with different passages cultured in hypoxia (5 % O2) or normoxia (20 % O2). a Normoxic cells in primary culture formed small ‘islets’, b cells of passage 3 cultured in normoxia showed a typical senescent cell morphology (enlarged and flattened cell body with increased cytoplasmic granularity), c hypoxic cells in primary culture formed big ‘islets’, d cells of passage 3 cultured in hypoxia maintained their spindle morphologies, exhibited uniform cell orientation within various regions and had a better growth within the culture

