Fig. 4.
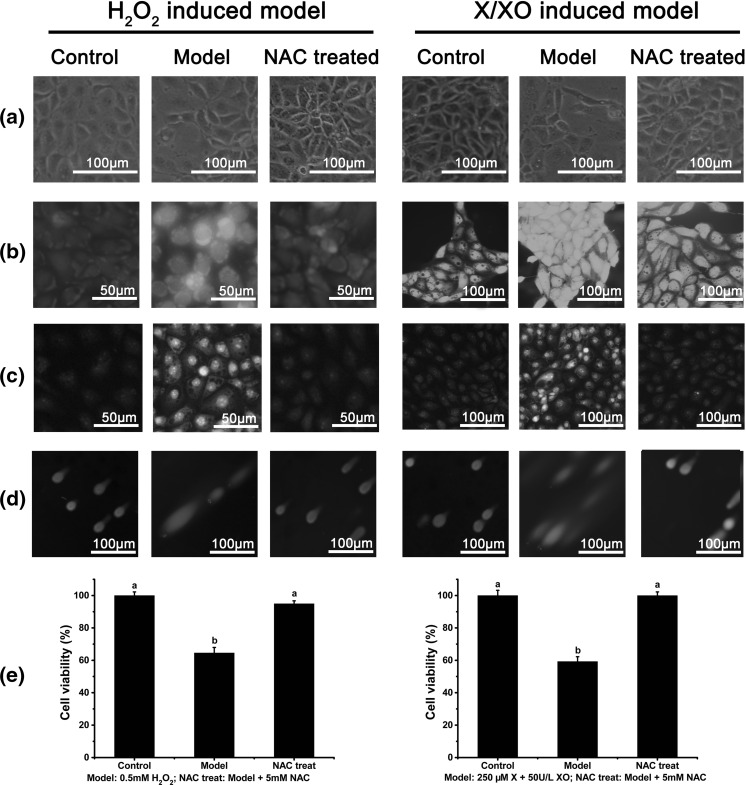
Modeling method analysis. In all experiments, the control group was normal IPEC-J2 cells; the model groups included modeling with 0.5 mM H2O2 for 1 h or with 250 μM X/50 U/L XO for 6 h, and in NAC groups (anti-apoptosis controls), 5 mM NAC was added at the same time for modeling. a Cells of different treatments were observed using a 100× inverted microscope. b Total intracellular free radicals were detected using a DCFH-DA probe for different treatment cells, and the images were captured using a fluorescence microscope with identical exposure. Higher fluorescence intensity indicates a higher degree of intracellular free radicals. c Superoxide anions were detected using a DHE probe for different treatments cells, and the images were captured using a fluorescence microscope with identical exposure. Higher fluorescence intensity indicates a higher degree of superoxide anions. d Comet assay image captured by fluorescence microscope; a longer tail indicates more serious DNA damage. For details concerning the statistical analysis, please refer to Table 1. e Cell viability of different treatments as analyzed by WST-8 dye. Different letters indicate significant differences (P < 0.05, n = 3)

