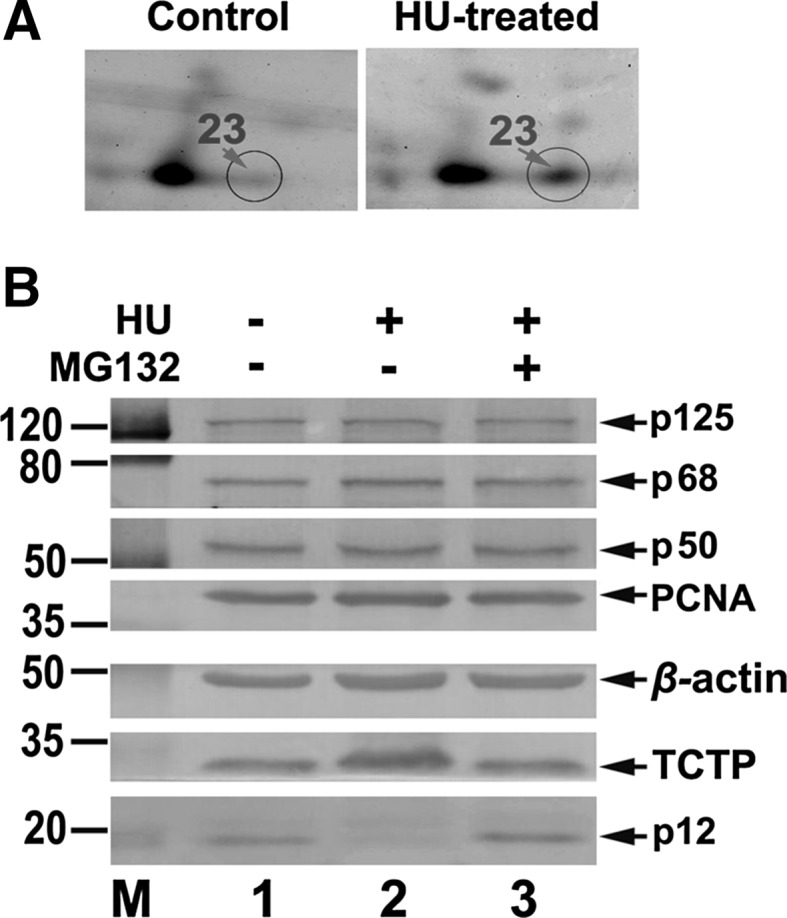
Fig. 5.

Validation of TCTP up-regulation versus p12 degradation. a An enlarged spot 23 in 2-DE gel. Left panel shows the 2-DE gel around spot 23 for non-treated group and right panel shows the 2-DE gel around spot 23 for HU-treated group. Circled spots 23 are indicated by arrows in red. b HeLa cells grown to ~70 % confluence were treated with 4 mM of HU, harvested by 8 h after incubation, and analyzed by Western blot. Group 1: non-treated cells as a control. Group 2: 4 mM of HU treated cells. Group 3: by the addition of 10 μM proteasome inhibitor MG132 into the culture medium 30 min before HU treatment. The numbers shown on the left indicate the positions in kDa protein markers (M). The four subunits of Pol δ (p125, p68, p50, and p12), PCNA, β-actin, and TCTP are indicated by arrows
