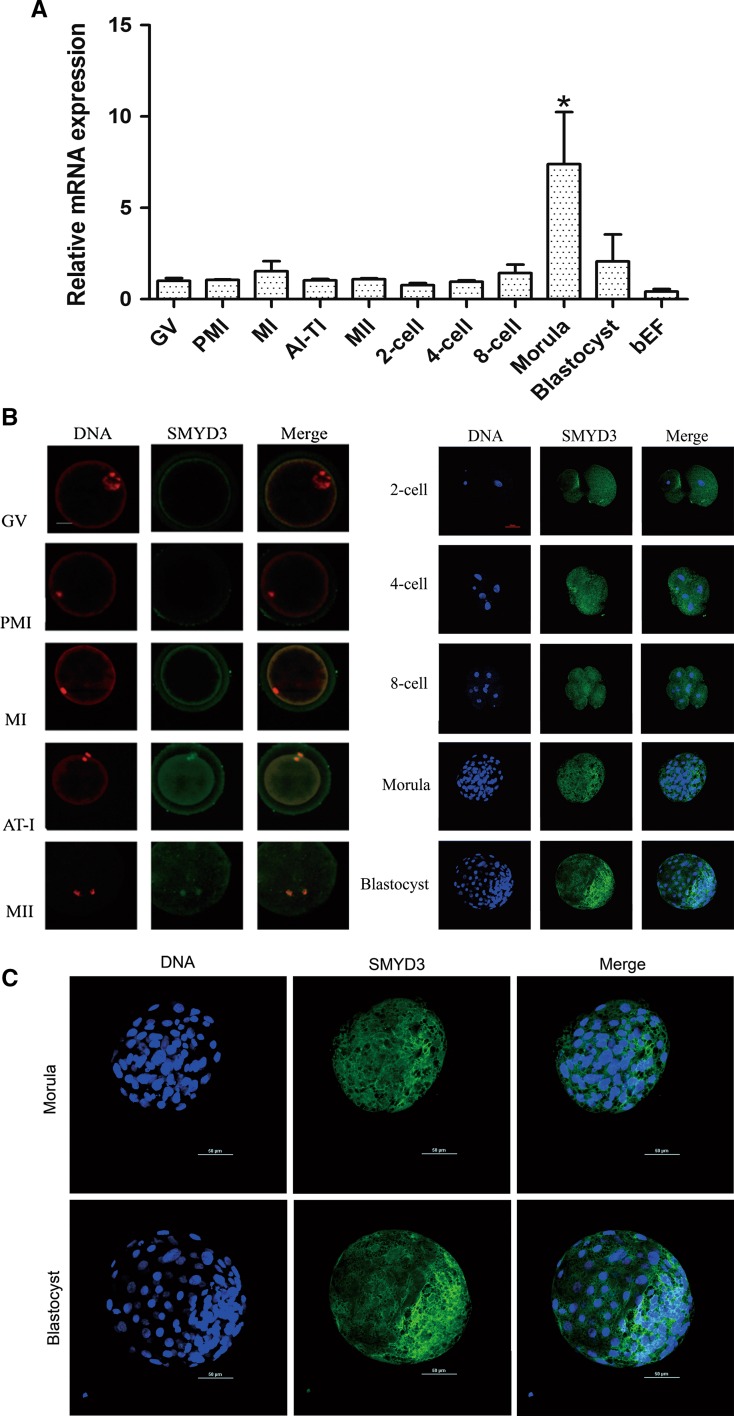
Fig. 1.
Expression and localization of SMYD3 in bovine maturing oocytes and early developing embryos. a qRT-PCR analysis of SMYD3 transcription in different stages of oocytes and embryos. Data were normalized to GAPDH. Error bars represent standard deviation (SD) (n = 3). *P < 0.01. b Representative images of immunostained oocytes and embryos showing SMYD3 expression and localization (green). DNA was stained with PI (red) or DAPI (blue). c Enlargement of the images of the morula and blastocyst stage embryos (presented in b) showing the SMYD3 localization primarily in cytoplasm. The experiments were performed in triplicate, and at least fifteen oocytes or embryos were observed each time. Scale bar 50 μm

