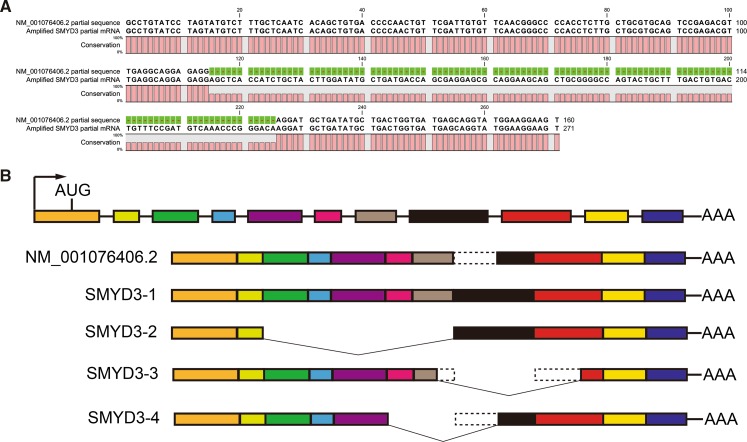
Fig. 3.
Schematic diagram of the structure of the SMYD3 splice variants. a Alignment of the SMYD3 partial sequence we amplified with the NCBI-published sequence (NM_001076406.2, partial sequence) by the CLC Sequence Viewer Software. b A graph of the SMYD3 splice variants we identified is shown alongside the NCBI-published sequence (NM_001076406.2). The color boxes represent exons and the dotted lines mean deletion parts of exons

