Fig. 7.

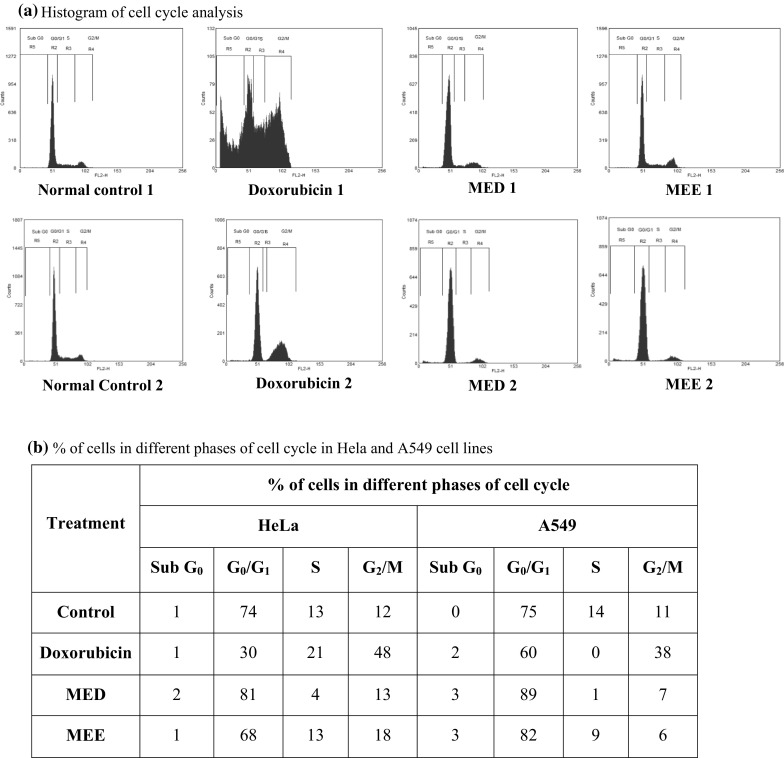
Cell cycle analysis by flow cytometry in cancer cell lines. Histogram showing phase of cell cycle arrest in various treatment groups. 1 indicates treatment in the HeLa cell line; 2 indicates treatment in the A549 cell line

Cell cycle analysis by flow cytometry in cancer cell lines. Histogram showing phase of cell cycle arrest in various treatment groups. 1 indicates treatment in the HeLa cell line; 2 indicates treatment in the A549 cell line