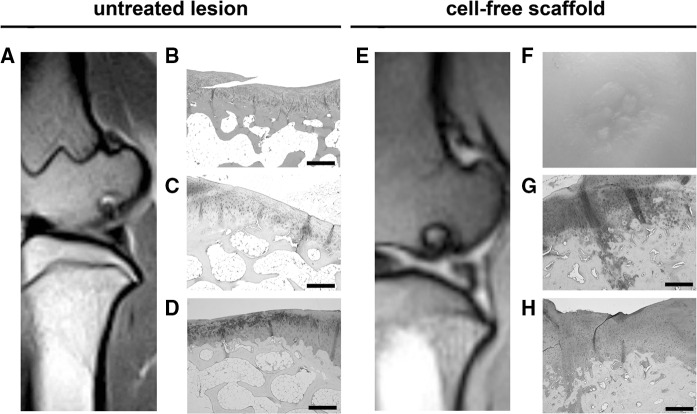
Fig. 3.
Untreated and cell-free scaffold control groups. MRI image from F58l (a), Haematoxylin and Eosin staining of a section from F52l (b), safranin O staining of a section from animal F52l (c) and immunohistochemical staining for type-II collagen on a tissue section from animal F59l (d). MRI image from F44r (e), macroscopic view of the defect site on condyle F44r (f); safranin O staining (g) and immunohistochemical staining for type-II collagen (h) on sequential sections of condyle F44r. Scale bars = 500 μm

