Abstract
In order to produce insulin-secreting cells with a high value of glucose-stimulated insulin secretion (GSIS) from mouse embryonic stem cells, we have developed an optimized 5-stage protocol by referring to culture conditions so far reported elsewhere. This protocol is characterized by 4 points: (1) use of an activin-free medium in the first stage, (2) use of gelatin/fibronectin coated culture dishes in 1–4 stages throughout, (3) removal of undifferentiated cells by cell sorter at the end of 4th stage, and (4) sedimental culture in the 5th stage. GSIS value of the produced cells reached 2.4, that was at a higher rank of those so far reported. The produced cells were transplanted in diabetes model mice but no remedy effect was observed. Then transplantation was conducted in pre-diabetes model mice, in which GSIS was impaired without affecting insulin producing function. The transplantation of 5 × 10⁶ cells resulted in a marked improvement of glucose tolerance within 20 days. This effect decreased but was still observed at 120 days post-transplantation. This demonstrates the feasibility of the novel optimized protocol.
Keywords: Glucose-stimulated insulin secretion, Insulin-secreting cells, Mouse ES cells, Pre-diabetes model mice
Introduction
Therapies for diabetes as well as for pre-diabetes involve the regulation of blood glucose level. Direct injection of insulin or oral administration of an agent that stimulates insulin secretion might be the most effective treatment for its temporal reduction. Such a treatment, however, must be conducted in a well-controlled manner, because its excessive reduction should cause acute hypoglycemia that might be as serious as hyperglycemia.
From this viewpoint, a high value of glucose-stimulated insulin secretion (GSIS) (Pound et al. 2013; Kuliawat et al. 2013; Komatsu et al. 2013) is an essential property of insulin-secreting cells. Until recently, GSIS values in cells derived in vitro from ES cells have been mostly no higher than 2 (Saito et al. 2013; Takeuchi et al. 2014). More recently an exceptionally high value around five has been reported (Sakano et al. 2014, plus their personal communication). However none of them has been able to take the place of isolated pancreatic islets that may maintain GSIS values in the range from 5 to 10 (Pound et al. 2013; Ohara-Imaizumi et al. 2013; Veras et al. 2014). Considering the difficulty of availability of isolated pancreatic islets, however, it is still an intense and urgent need to develop a protocol for the in vitro production of insulin-secreting cells with as high GSIS value as possible.
During development in vivo, pancreas forms en route from ES cells via definitive endoderm (DE), pancreatic gut tube (PG), pancreatic foregut endoderm (PF), pancreatic endoderm (PE), and hormone-expressing endocrine cells (EN). Based on this differentiation process, a 5-stage protocol sectioned by DE, PG, PF, PE, and EN was proposed and respective stage-specific marker genes were identified (D’Amour et al. 2006). Such a 5-stage protocol that mimics the in vivo differentiation process seems to be a rational one. Therefore we have designed a similar protocol comprised of the same 5-stages.
There are a number of factors that are speculated to be essential for regular differentiation and efficient growth. We have selected those factors that have recently been used in common. Among them, activin used in the 1st stage is an exception. The role of activin in inducing DE is still unclear (Beattie et al. 2005; James et al. 2005; Vallier et al. 2005). Therefore we have decided to use activin-free medium. Then we have introduced gelatin/fibronectin coated dishes instead throughout the stages 1–4. As suggested by Parashurama et al. (2008) and by Tuch et al. (2014), culture matrices such as fibronectin-coated collagen gel and 3D scaffolds where cells grow and form cell aggregates might be more important than specific soluble agents. In addition to these culture conditions, we have inserted the cell sorting process at the end of 4th stage in order to remove undifferentiated cells and to decrease the risk of teratoma generation after transplantation. Moreover the final stage was performed by a sedimental culture based on the suggestion by Jiang et al. (2007) that pancreatic cells may express their function efficiently by forming aggregates.
The therapeutic efficacy of produced cells has been evaluated by test methods using diabetes and pre-diabetes model mice. Diabetes model mice were prepared by treatment with streptozotocin (STZ) to cause the dysfunction of β-cells. Consequently acute hyperglycemia occurred and blood glucose level exceeded a level of diabetes. On the other hand, pre-diabetes model mice were those produced by systemic heterozygous knockout of glucokinase gene (Gk). Glucokinase is a rate-limiting enzyme in the glucose metabolic pathway (Postic et al. 1999; Printz and Granner 2005). The decrease of Gk expression causes the suppression of glucose response, and then impaired insulin secretion. Consequently it caused hyperglycemia but did not give rise to diabetes.
Materials and methods
ES cell culture
ES cell line used in this study was EB3, which was derived from E14tg2a ES cells and kindly provided by H. Niwa (Riken CDB, Kobe, Japan). These cells were maintained in the absence of feeder cells in ES medium consisting of Glasgow minimum essential medium (GMEM, Sigma-Aldrich Co., St. Louis, MO, USA) supplemented with 10 % fetal bovine serum (FBS, Hyclone, GE Healthcare Life Sciences, South Logan, UT, USA), 1 × non-essential amino acids (Invitrogen, Carlsbad, CA, USA), 2 mM l-glutamine (Invitrogen), 1 mM sodium pyruvate (Invitrogen), 10−4 M 2-mercaptoethanol and 1000 U/ml leukemia inhibitory factor (LIF, Invitrogen) on gelatin-coated dishes. Cells were incubated in a 5 % CO2-air mixture at 37 °C.
In vitro differentiation
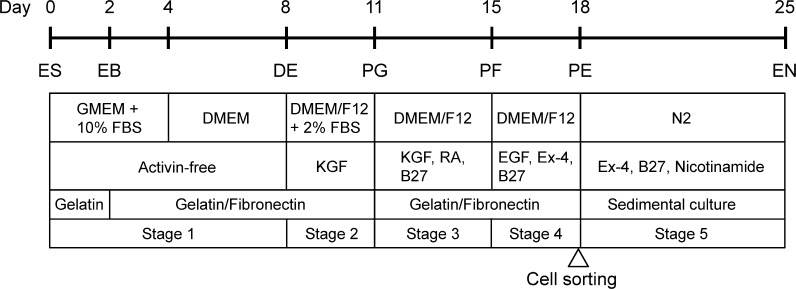
The differentiation protocol was divided into the following 5-stages depicted in Fig. 1:
Fig. 1.
Outline of a novel 5-stage protocol for the differentiation of mES cells into insulin-secreting cells. ES, mES cells; EB, embryoid bodies; DE, definitive endoderm; PG, primitive gut tube; PF, posterior foregut endoderm; PE, pancreatic endoderm; EN, hormone-expressing endocrine cells
Stage 1: ES cells were dissociated into a single-cell suspension with 0.25 % trypsin/0.04 % EDTA (Tr/Ed) and cultured at 15 × 105 cells/10 ml in gelatin-coated 90 mmϕ dishes containing a differentiation medium consisting of GMEM supplemented with 10 % FBS, 1 × non-essential amino acids, 2 mM l-glutamine, 1 mM sodium pyruvate, 10−4 M 2-mercaptoethanol. Cultures were maintained in a 5 % CO2-air mixture at 37 °C for 2 days, resulting in EB formation. Then EB were harvested and plated on gelatin/fibronectin-coated 6-well dishes containing the same differentiation medium and cultured for another 2 days. After that the medium was changed to a serum-free DMEM medium (Invitrogen), and culture was continued for four additional days.
Stage 2: Cells were briefly washed with a phosphate buffer saline (PBS) and then cultured in a DMEM/F-12 medium (Invitrogen) containing 2 % FBS and 10 ng/ml keratinocyte growth factor (KGF, Sigma-Aldrich Co.). The cultures were maintained in a 5 % CO2-air mixture at 37 °C for 3 days.
Stage 3: Cells were dissociated by treatment with Tr/Ed and plated on gelatin/fibronectin-coated 6-well dishes containing the DMEM/F-12 medium, 10 ng/ml KGF, 2 mM all-trans retinoic acid (RA, Sigma-Aldrich Co.), and 1 % B27 (Invitrogen). Then cultures were maintained in a 5 % CO2-air mixture at 37 °C for 4 days.
Stage 4: Cells were briefly washed with PBS and then cultured in the DMEM/F-12 medium containing 50 ng/ml exendin-4 (Ex-4, Sigma-Aldrich Co.), 30 ng/ml epidermal growth factor (EGF, Sigma-Aldrich Co.), 1 % B27 in a 5 % CO2-air mixture at 37 °C for 3 days. At the end of this stage, cells were washed with PBS and dissociated with Tr/Ed for 5 min to obtain a single-cell suspension. They were then stained with a mouse anti-SSEA-1 antibody labelled with PerCP-Cy5.5 (Santa Cruz Biotechnology, Inc., Dallas, TX, USA) for 40 min on ice. The cells were washed with 2 % FBS/PBS and re-suspended in the same 2 % FBS/PBS. Thus treated cells were applied to a cell sorter (FACS AriaII, BD Biosciences, San Jose, CA, USA) to collect SSEA-1 negative viable cells.
Stage 5: SSEA-1 negative viable cells were transferred in uncoated culture dishes for sedimental culture. At the start of culture, the cells were suspended in N2 medium (Invitrogen) containing 10 mM nicotinamide (Sigma-Aldrich Co.), 50 ng/ml Ex-4, and 1 % B27. Here N2 medium is comprised of DMEM/F-12, 500 ng/ml insulin, 2 mg/ml transferrin, 0.4 nM progesterone, 1.2 mM putrescine, and 0.6 nM sodium selenite. Then the cells were left standing still during successive culture for 7 days in a 5 % CO2-air mixture at 37 °C so that they might sediment gently to form cell aggregates. Thus formed “sediment” implies the piles of cells on the culture dish. The matter of interest is cell–cell contact and supposedly occurring cell–cell communication. The sedimental culture contrasts to adherent culture that focuses the contact of each cell on solid surface. The physical stabilization of cell should be a matter of interest.
RNA isolation, reverse transcription PCR (RT-PCR), and quantitative RT-PCR (qRT-PCR)
Total RNA was prepared using ISOGEN reagent (Nippongene, Tokyo, Japan) according to the manufacturer’s instruction. Oligo(dT)-primed cDNA was prepared from 1 μg of total RNA using SuperScript reverse transcriptase (Clontech, Tokyo, Japan).
RT-PCR was performed with ExTaq polymerase (TaKaRa, Otsu, Japan) according to the manufacturer’s protocol. The amplification conditions were as follows: 94 °C for 5 min followed by 25–40 cycles of a reaction set [94 °C denaturation for 30 s, 55–62 °C annealing for 30 s, 72 °C elongation for 1 min], with a final incubation at 72 °C for 7 min. The primers for RT-PCR were designed using the information described in Moritoh et al. (2003) or mouse sequences reported elsewhere. PCR products were separated by agarose gel electrophoresis and visualized with ethidium bromide. If necessary, thus visualized fluorescent bands were quantified using an image analyzing program ImageJ.
qRT-PCR was performed with cell samples differentiated in vitro and those prepared from organs of mice. The cell samples were treated with SYBR Green PCR Master Mix (Applied Biosystems, Foster City, CA, USA) using ABI Prism 7000 Sequence Detection System (Applied Biosystems). The PCR reaction mixture comprised of 10 ml SYBR Green PCR Master Mix, 2 ml of 10 pmol/ml forward and reverse primers, 5 ml H2O, and 1.0 ml template cDNA in a total volume of 20 ml. Amplification was performed using the default conditions of the ABI 7000 Software: 95 °C for 10 min, followed by 40 cycles of a reaction set [95 °C for 15 s and 60 °C for 1 min]. The amount of target RNA was normalized against the amount of Gapdh or Hprt mRNA. The following primer sets were used:
Sox17, forward 5′-GTAAAGGTGAAAGGCGAGGTG-3′, and reverse 5′-GTCAACGCCTTCCAAGACTTG-3′;
Foxa2, forward 5′-GGGAGCGGTGAAGATGGA-3′ and reverse 5′-TCATGTTGCTCACGGAGGAGTA-3′;
Gata4, forward 5′-TCCATGTCCCAGACATTCAGTACT-3′ and reverse 5′-AGCAGACAGCACTGGATGGAT-3′;
Brachyury, forward 5′-TGCTGCAGTCCCATGATAACTG-3′ and reverse 5′-ATGACTCACAGGCAGCATGCT-3′;
Mixl1, forward 5′-CTACCCGAGTCCAGGATCCA-3′ and reverse 5′-ACTCCCCGCCTTGAGGATAA-3′;
Gk, forward 5′-TCCCTGTAAGGCACGAAGACA-3′ and reverse 5′-GCCACCACATCCATCTCAAGG-3′;
Gapdh, forward 5′-TGTGTCCGTCGTGGATCTGA-3′ and reverse 5′-CCTGCTTCACCACCTTCTTGA-3′;
Hprt forward 5′- TGGATACAGGCCAGACTTTGTT-3′ and reverse 5′-CAGATTCAACTTGCGCTCATC-3′.
Immunostaining of insulin-secreting cells
At the end of the 5th stage, the medium in the culture dish was gently removed and the sediment of cells on the dish bottom were washed with PBS. Then the cells were fixed by treatment with 2 ml 4 % paraformaldehyde for 45 min. After the fixation, the cells were washed three times with PBS and then treated with 100 % ethanol to permeabilize the cell membrane. The cells were washed again three times with a glycine/PBS solution and finally treated with 2 % gelatin for 15 min. After that the cells were washed three times with a glycine/PBS solution and then incubated in 0.1 % BSA/PBS for 5 min. After the removal of this BSA/PBS solution, guinea pig anti-mouse-insulin antibody (Dako Japan, Tokyo, Japan) and rat anti-mouse-C-peptide antibody (Cell Signaling Technology Japan, K.K., Tokyo, Japan) were added to the dish. The cells were incubated with the antibodies at 37 °C for 40 min. Then the reaction solution was removed and the cells were washed six times with 0.1 % BSA/PBS. Next the cells were double stained with Alexa-568-conjugated goat anti-guinea pig antibody and Alexa-488-conjugated goat anti-rat antibody at 37 °C for 40 min. The cells were washed six times with 0.1 % BSA/PBS. The cells were stained also with DAPI (Sigma-Aldrich, St. Louis, USA) to visualize nuclei. Fluorescent images were captured with a fluorescence microscope (IX-71, Olympus, Tokyo, Japan).
ELISA for insulin secreted from cells
To test whether the insulin release of differentiated cells was responsive to glucose levels, cells were exposed to one of three glucose concentrations, namely 0 mM, 3.3 mM, or 33 mM. After the 5th stage, cells were rinsed four times with DMEM containing 3.3 mM glucose and 10 mM HEPES, and incubated for 30 min in 1 ml of the same medium. The cells were rinsed again five times with the same medium and incubated for another 30 min. Finally the cells were washed five times with the same medium to remove the insulin background. Krebs–Ringer solution containing 0 mM, 3.3 mM, or 33 mM glucose was then added to the dish. After incubation at 37 °C for 1 h, the reaction solution was separated and assayed for insulin concentration using the Ultrasensitive Mouse Insulin ELISA Kit (Mercodia, Uppsala, Sweden). The cell density in each dish was measured separately and two dishes for each density were assayed. The numbers of dishes assayed for 0 mM, 3.3 mM, and 33 mM glucose were 4, 6, and 6, respectively.
Determination of GSIS value
GSIS value was determined by 2 ways. At first, it was calculated by the formula: [Y(33)–Y(0)]/[Y(3.3)–Y(0)], where Y(0), Y(3.3), Y(33) are the quantities of insulin per 105 cells secreted in response to 0 mM, 3.3 mM, and 33 mM glucose, respectively. The second formula was simple ratio: Y(33)/Y(3.3) including the effect of glucose independent secretion.
Diabetes and pre-diabetes model mice
Diabetes model mice were prepared by applying STZ (Sigma-Aldrich, St. Louis, MO, USA) to 5-week-old male BALB/cA Jcl-nu/nu mice at 100 µg/g body weight (BW) through intraperitoneal injection on three consecutive days for a total dose of 300 µg/g BW.
Pre-diabetes model mice were those previously developed by systemic heterozygous knockout of Gk and registered as B6;129-Gcktm1Tms (http://ilarlabcode.nas.edu/search_codes_full.php?labcode_id=9447&user_id=57616).
Transplantation
Using a micro pipette, 5 × 10⁶ differentiated cells were introduced into the renal capsule of diabetes and pre-diabetes model mice.
Glucose tolerance test and blood assay
Mice were challenged with an oral administration of 2 mg/g BW of glucose following an overnight fast. Blood samples were drawn from the tail vein at 0, 15, 30, 60, 90, and 120 min post-treatment for measurement of blood glucose levels at each time point. Glucose concentration was measured with a G-sensor (ARKRAY Inc., Kyoto, Japan).
Histochemical analysis
Cryostat sections of the kidneys were prepared and the insulin and C-peptide expressions in the transplanted cells in the renal capsule were confirmed by immunohistochemistry. The ES-derived cells were stained using a guinea pig anti-mouse-insulin antibody and a rat anti-mouse-C-peptide antibody, or by hematoxylin/eosin (HE) staining. Images were captured using a fluorescence microscope.
Ethical guideline
All experimental procedures involving animals were conducted following the guideline of the “Guide for the Care and Use of the Laboratory Animals” of Tokyo University of Agriculture and Technology, Japan.
Results
Differentiation of ES cells
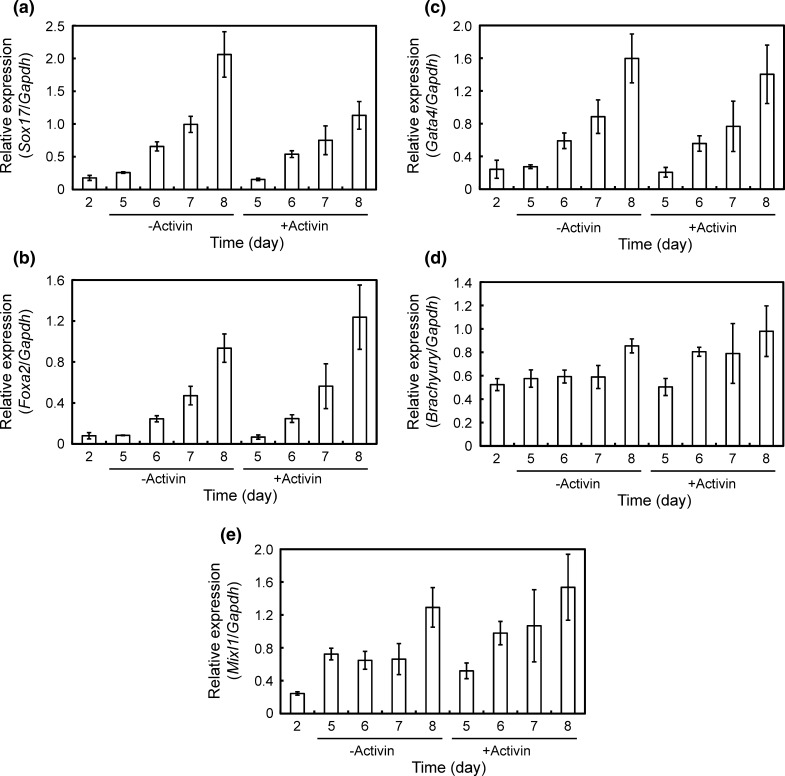
According to the protocol depicted in Fig. 1, mES cells were differentiated into insulin-secreting cells. In the first stage, we investigated the effect of activin on the formation of DE and found no effect on the expression of DE-associated genes such as Sox17, Foxa2, Gata4, Brachyury, and Mixl1 (Fig. 2). Therefore activin was speculated to be unnecessary for the formation of DE under the present culture condition.
Fig. 2.
Effects of activin during the 1st stage on the expression profiles of DE-associated gene. a Sox17. b Foxa 2. c Gata4. d Brachyury. e Mixl1. The gene expression intensity was analyzed by qRT-PCR and normalized versus Gapdh expression intensity. Error bars indicate mean ± SD for n = 3
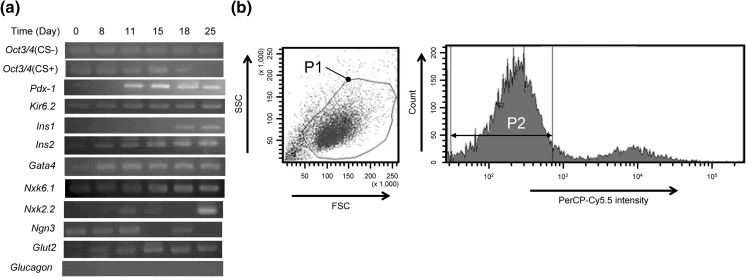
In the 2nd stage, KGF was selected as an active inducer towards PG, because KGF was known to induce the differentiation into pancreatic precursors. In fact, the expression of Pdx1 increased markedly (Fig. 3a). This gene is well understood to be a master gene for the generation of early pancreatic development (Soria 2001) as well as of β-cells.
Fig. 3.
Gene expression profiles during stages 2–5 and cell sorting. a Results of RT-PCR. Oct3/4 (CS +) indicates a sample that was applied to cell sorter at 18th day and then cultured until 25th day. Oct3/4 (CS-) indicates a sample that was cultured without cell sorting. b A flow cytogram for the selection of SSEA-1 negative and viable cells. P1 roughly encircles a sorting gate for viable cells. P2 indicates a sorting gate for SSEA-1 negative cells. SSEA-1 was labelled with PerCP-Cy5.5. Cells within the double gate of P1 and P2 were collected
In the 3rd stage, two more factors, RA and B27 were added to KGF as inducers for PF. Then, in the 4th stage, RA and KGF were replaced by EGF and Ex-4 for the differentiation into PE. The expression of PF and/or PE marker genes such as Nkx6.1, Nkx2.2, and Ngn3 was observed (Fig. 3a), though their expression patterns were not necessarily the same as those associated with human ES cell (D’Amour et al. 2006).
At the end of 4th stage, the cells were applied to a cell sorter. Experimentally, the P1 and P2 doubly gated fraction in the flow cytogram (Fig. 3b) was assigned as a SSEA-1 negative and viable cell fraction. The relative number of SSEA-1 negative cells in this fraction to the total number of cells applied was 87 %. The expression of Oct3/4 was not observed in this fraction (Fig. 3a), indicating that undifferentiated cells could be removed completely by cell sorting.
Finally, in the 5th stage, cells were suspended in N2 medium containing Ex-4, B27, and nicotinamide to promote the maturation of pancreatic cells and to form spherical clusters of EN. The expression of EN marker genes such as Pdx1, Kir6.2, Ins1, and Ins2 was observed (Fig. 3a). At this stage, the cells expressed also pancreatic β-cell markers such as Gata4, Nkx6.1, Nkx2.2, Ngn3 and Glut2. In contrast, glucagon expression was not detected, indicating no generation of α-cell.
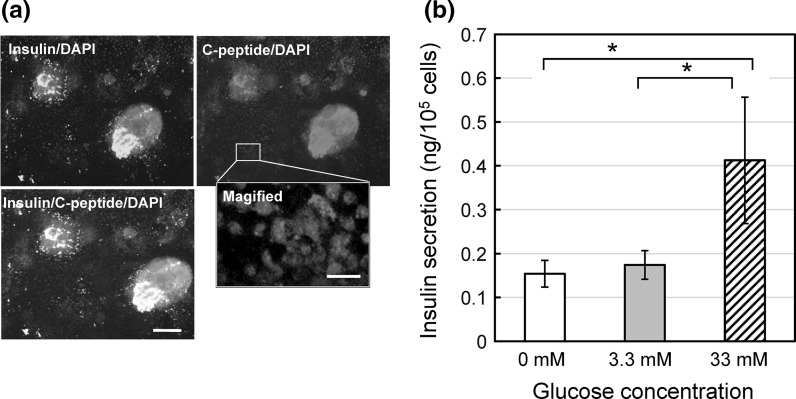
These results suggest the generation of insulin-secreting cells similar to β-cells. Cell clusters generated in the stage five were plated onto gelatin/fibronectin coated dishes and allowed to adhere to the surface. The immunostaining of these cell clusters revealed the presence of insulin and C-peptide (Fig. 4a). Their fluorescence intensities were not uniform. A magnified image shows that C-peptide is located in respective cells (Fig. 4a, magnified panel). In the cells, C-peptide seems to be distributed in the cytosol. Therefore it was speculated that the differentiated cells were really insulin-producing cells.
Fig. 4.
Insulin-secreting activity in vitro of cells produced by the present method. a Fluorescent images of insulin (green), C-peptide (red) and nucleus (blue) in cells collected after the 5th stage. Scale bars in the merge and the magnified panels indicate 100 and 20 μm, respectively. b GSIS activity. mean ± SEM for n = 4, 6, and 6 for 0 mM, 3.3 mM, and 33 mM glucose concentrations, respectively. (*) p < 0.1 by one-tailed t test. (Color figure online)
Then the cells were exposed to different concentrations of glucose to evaluate GSIS. The insulin secretion occurred even in the absence of glucose, suggesting a glucose independent effect. When the glucose concentration was raised to 3.3 mM and 33 mM, the quantities of secreted insulin increased as depicted in Fig. 4b. The one tailed t test showed that the difference between Y(33) and Y(3.3) and the difference between Y(33) and Y(0) were statistically significant by p < 0.1. The GSIS including the glucose independent effect was determined as Y(33)/Y(3.3) = 2.4, while GSIS including only glucose dependent effect was determined as [Y(33)–Y(0)]/[Y(3.3)–Y(0)] = 12.9. These values were high enough for further developmental studies, for instance, on the effect of glucose independent secretion of insulin.
Transplantation of the produced cells into diabetes and pre-diabetes model mice
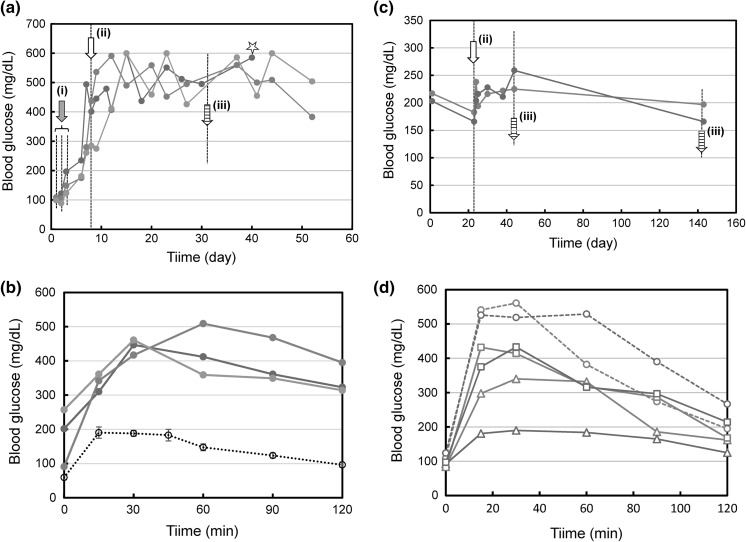
After repeated treatments with STZ on the 1st–3th days, the produced cells were transplanted into mice at the 8th day (Fig. 5a). The blood glucose concentration increased and became a steady level at 500–600 mg/dl around 10–15th day. On the 32nd day, the glucose tolerance test was performed. However no improvement of glucose tolerance was observed in three tested mice (Fig. 5b). We suspected that the therapeutic efficacy of produced cells was insufficient for the impaired level of glucose tolerance caused by STZ treatment. On the 40th day, a kidney was extirpated from one of the tested mice for histochemical analysis described below.
Fig. 5.
Effects of transplantation of produced cells on the blood glucose level. a Casual blood glucose levels in STZ-treated mice. STZ was applied to three mice on 3 consecutive days (arrow (i)). At the arrow (ii), transplantation was conducted. At the arrow (iii), glucose tolerance test was conducted. At the star, a kidney was extirpated for histochemical analysis. b Result of glucose tolerance test conducted with STZ-treated mice. Red, blue, and green lines correspond to the individual mice indicated by the same colored lines, respectively, in (a). A black broken line indicates control data obtained with wild mice (mean ± SEM, for n = 10). c Casual blood glucose levels in Gk(+/−) mice. At the arrow (ii), transplantation was conducted. At the arrows (iii), glucose tolerance tests were conducted. d Results of glucose tolerance tests conducted with Gk(+/−) mice. Broken lines are the result before transplantation. Triangles and squares indicate results on the 20th day and the 120th day post-transplantation, respectively. Red and blue lines correspond to the individual mice indicated by the same colored lines, respectively, in (c). (Color figure online)
Next we used pre-diabetic model mice, in which the impaired level might be less serious. In fact, the casual level of blood glucose and the glucose tolerance level were at intermediate levels between those of wild and diabetes model mice.
Two mice with similar property of glucose tolerance were selected and applied to the transplantation experiment. After pre-transplantation breeding for 22 days, the produced cells were transplanted into these 2 mice. After that breeding was continued until at 140th day. The casual level of blood glucose in a blue-lined mouse seemed to be lowered (Fig. 5c). A more remarkable result was the improvement of glucose tolerance observed in the blue-lined mouse on the 20th day post-transplantation (Fig. 5d). The same effect was observed also in the red-lined mouse, though its effect was less remarkable. Such an effect of glucose tolerance improvement decreased in the process of breeding but still could be observed on the 120th day post-transplantation.
Histochemical analytical results
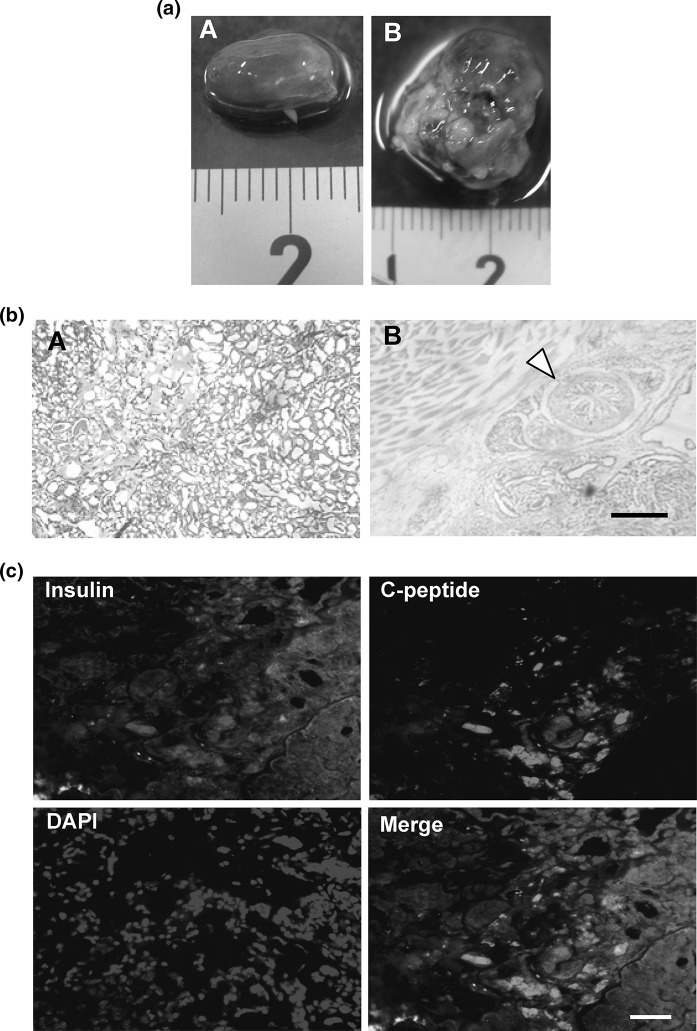
There was no teratoma in the kidney where SSEA-1 negative cells were transplanted (Fig. 6aA), while teratoma was generated when SSEA-1 positive cells remained (Fig. 6aB). Histochemical analysis by HE staining revealed that no abnormal cell was generated when SSEA-1 negative cells were transplanted (Fig. 6bA), while heterocysts such as intestine-like and muscle-like structures were generated when the cells containing SSEA-1 positive cells were transplanted (Fig. 6bB). The immunostaining of insulin and C-peptide showed that the SSEA-1 negative cells maintained the insulin producing activity in vivo (Fig. 6c). This suggests that no therapeutic effect on diabetes model mice was not caused by the loss of function but by the shortage of function. This was supported by the effects on pre-diabetes model mice demonstrated above.
Fig. 6.
Histochemical analytical results. a Effect of the removal of SSEA-1 positive cells on the formation of teratoma. (A) A kidney taken out at the star in Fig. 5a. (B) A kidney taken out from another mouse in which the produced cells were transplanted separately without removal of SSEA-1 positive cells. b Cell morphology revealed by HE staining. (A) a section prepared from (aA). (B) a section prepared from (aB). A triangle indicates an intestine-like structure. Scale bar indicates 500 μm. c Fluorescent images of insulin, C-peptide, and nucleus of a section prepared from (aA). Scale bar indicates 50 μm. (Color figure online)
Discussion
Since the pioneering work by Lumelsky et al. (2001), a number of studies on the in vitro production of insulin-secreting cells have focused on the finding of novel factors and culture conditions that may improve their therapeutic efficacy in vivo. However the value of GSIS attained so far is still insufficient for practical purposes. In order to attain a higher value of GSIS, we have designed a novel protocol that is characterized by four points.
First of all, we decided to use activin-free medium. The differentiation process from EB to DE in vivo is complex as described elsewhere (Stainier 2002; Kubo et al. 2004; Yasunaga et al. 2005; Ogawa et al. 2007; Sherwood et al. 2007; Kunisada et al. 2012). These studies focused on activin, because its involvement was unclear but seemed to be indispensable. In fact, however, the expression of DE-associated genes were not influenced by activin. This suggested that there should be an activin independent differentiation route from EB to DE.
Gelatin is a popular material used in the culture of ES cells. Though we were stimulated by the report on collagen-gel/fibronectin combination (Parashurama et al. 2008), we thought that it was better to use gelatin coating instead of collagen gel, resulting in a successful result. The use of gelatin/fibronectin is the 2nd important point in our protocol.
Post-DE process is much more complex than the EB to DE process. Candidates of effective factors for its process are, for instance, RA, N2 supplement, B27, nicotinamide, and forskolin (Kroon et al. 2008; Jiang et al. 2007; Kunisada et al. 2012). More recently it has been reported that vesicular monoamine transporter 2 (VMAT2) inhibitors are effective to promote late-stage differentiation of Pdx-1 positive pancreatic progenitor cells into endocrine precursors (Schäfer et al. 2013; Sakano et al. 2014). However none of them seems to be able to make a breakthrough. That is why the mimicry of in vivo process is still thought to be a rational way and therefore we have introduced most of these factors.
The third point in our protocol was the cell sorting conducted at the end of the 4th stage. It is understood that undifferentiated cells should disappear in the process of differentiation in vivo. Our 5-stage protocol was designed by mimicking this in vivo process. Therefore we suspected that undifferentiated cells should disappear during our in vitro process. In fact, however, 17 % of cells collected at the end of the 4th stage were undifferentiated cells and caused the formation of teratoma after transplantation. This indicates that the present mimic protocol was incomplete. Technically a flow cytometric method could remove those undifferentiated cells completely. Practically, however, this step had better be skipped.
The last point was the sedimental culture in the 5th stage. Considering the in vivo environment, this point was thought to be reasonable. The cells were suspended at the start of the 5th stage and therefore they were floating in the medium for a while. After sediment, the cells aggregated at the bottom of the culture dish which was kept without stirring. We suspect that such a sediment culture could contribute to a successful result of this study. At the same time, however, we thought that this culture condition might not necessarily be the best one. An alternative way of constant stirring is thought to be worth considering, because dynamic cell–cell contacts during culture might be effective for more efficient growth and a higher GSIS value.
At the end of the 5th stage, the produced cells were tested for their GSIS value according to the formulas: Y(33)/Y(3.3) and [Y(33)–Y(0)]/[Y(3.3)–Y(0)]. According to the former formula, GSIS was 2.4, which was a similar level to those so far reported elsewhere. In contrast, GSIS reached 12.9 according to the latter formula, though such an effect of glucose independent secretion needs to be investigated. A possible cause might be uncontrollable action of intracellular Ca2+. According to the well understood scheme of GSIS, the final step to secrete insulin is the membrane fusion of insulin containing vesicles with the cell membrane by Ca2+. In viable cells, however, intracellular Ca2+ may be provided not only via glucose dependent pathways. Therefore it might not be strange if insulin secretion was caused by Ca2+ provided via a glucose independent pathway.
Following the production of insulin secreting cells, the quantitative method for the evaluation of their therapeutic efficacy is essential. Diabetes model mice such as STZ-treated mice or Akita mouse may be used for the evaluation of the efficacy of pharmaceuticals that are required to be effective enough to remedy diabetes. On the way of fundamental studies aiming at more efficient factors and culture conditions, however, the expected effects might not be high enough to be detected by those model mice. From this viewpoint, the test animals had better be sensitive to slight improvement effect. Therefore we have focused our attention on the pre-diabetes model. As demonstrated in this study, pre-diabetes model mice were sensitive enough to be able to detect the efficacy of the produced cells produced in this study. Such a high sensitivity to therapeutic efficacy on diabetes is an important aspect from the viewpoint of developmental studies towards a much more effective therapy.
Acknowledgments
We thank Dr. Niwa for the donation of feeder free EB3 cells, and Dr. Okitsu for excellent technical support on transplantation. The work was supported in part by the Strategic Research Promotion Program, the Ministry of Education, Culture, Sports, Science, and Technology, on the research subject “Development of Next Generation Bioresources”.
References
- Beattie GM, Lopez AD, Bucay N, Hinton A, Firpo MT, King CC, Hayek A. Activin A maintains pluripotency of human embryonic stem cells in the absence of feeder layers. Stem Cells. 2005;23:489–495. doi: 10.1634/stemcells.2004-0279. [DOI] [PubMed] [Google Scholar]
- D’Amour KA, Bang AG, Eliazer S, Kelly OG, Agulnick AD, Smart NG, Moorman MA, Kroon E, Carpenter MK, Baetge EE. Production of pancreatic hormone-expressing endocrine cells from human embryonic stem cells. Nat Biotechnol. 2006;24:1392–1401. doi: 10.1038/nbt1259. [DOI] [PubMed] [Google Scholar]
- James D, Levine AJ, Besser D, Hemmati-Brivanlou A. TGFbeta/activin/nodal signaling is necessary for the maintenance of pluripotency in human embryonic stem cells. Development. 2005;132:1273–1282. doi: 10.1242/dev.01706. [DOI] [PubMed] [Google Scholar]
- Jiang W, Shi Y, Zhao D, Chen S, Yong J, Zhang J, Qing T, Sun X, Zhang P, Ding M, Li D, Deng H. In vitro derivation of functional insulin-producing cells from human embryonic stem cells. Cell Res. 2007;17:333–344. doi: 10.1038/cr.2007.28. [DOI] [PubMed] [Google Scholar]
- Komatsu M, Takei M, Ishii H, Sato Y. Glucose-stimulated insulin secretion: a newer perspective. J Diabetes Investig. 2013;4:511–516. doi: 10.1111/jdi.12094. [DOI] [PMC free article] [PubMed] [Google Scholar]
- Kroon E, Martinson LA, Kadoya K, Bang AG, Kelly OG, Eliazer S, Young H, Richardson M, Smart NG, Cunningham J, Agulnick AD, D’Amour KA, Carpenter MK, Baetge EE. Pancreatic endoderm derived from human embryonic stem cells generates glucose-responsive insulin-secreting cells in vivo. Nat Biotechnol. 2008;26:443–452. doi: 10.1038/nbt1393. [DOI] [PubMed] [Google Scholar]
- Kubo A, Shinozaki K, Shannon JM, Kouskoff V, Kennedy M, Woo S, Fehling HJ, Keller G. Development of definitive endoderm from embryonic stem cells in culture. Development. 2004;131:1651–1662. doi: 10.1242/dev.01044. [DOI] [PubMed] [Google Scholar]
- Kuliawat R, Klein L, Gong Z, Nicoletta-Gentile M, Nemkal A, Cui L, Bastie C, Su K, Huffman D, Surana M, Barzilai N, Fleischer N, Muzumdar R. Potent humanin analog increases glucose-stimulated insulin secretion through enhanced metabolism in the cell. FASEB J. 2013;27:4890–4898. doi: 10.1096/fj.13-231092. [DOI] [PMC free article] [PubMed] [Google Scholar]
- Kunisada Y, Tsubooka-Yamazoe N, Shoji M, Hosoya M. Small molecules induce efficient differentiation into insulin-producing cells from human induced pluripotent stem cells. Stem Cell Res. 2012;8:274–284. doi: 10.1016/j.scr.2011.10.002. [DOI] [PubMed] [Google Scholar]
- Lumelsky N, Blondel O, Laeng P, Velasco I, Ravin R, McKay R. Differentiation of embryonic stem cells to insulin-secreting structures similar to pancreatic islets. Science. 2001;292:1389–1394. doi: 10.1126/science.1058866. [DOI] [PubMed] [Google Scholar]
- Moritoh Y, Yamato E, Yasui Y, Miyazaki S, Miyazaki J. Analysis of insulin-producing cells during in vitro differentiation from feeder-free embryonic stem cells. Diabetes. 2003;52:1163–1168. doi: 10.2337/diabetes.52.5.1163. [DOI] [PubMed] [Google Scholar]
- Ogawa K, Saito A, Matsui H, Suzuki H, Ohtsuka S, Shimosato D, Morishita Y, Watabe T, Niwa H, Miyazono K. Activin-Nodal signaling is involved in propagation of mouse embryonic stem cells. J Cell Sci. 2007;120:55–65. doi: 10.1242/jcs.03296. [DOI] [PubMed] [Google Scholar]
- Ohara-Imaizumi M, Kim H, Yoshida M, Fujiwara T, Aoyagi K, Toyofuku Y, Nakamichi Y, Nishiwaki C, Okamura T, Uchida T, Fujitani Y, Akagawa K, Kakei M, Watada H, German MS, Nagamatsu S. Serotonin regulates glucose-stimulated insulin secretion from pancreatic β cells during pregnancy. Proc Natl Acad Sci USA. 2013;110:19420–19425. doi: 10.1073/pnas.1310953110. [DOI] [PMC free article] [PubMed] [Google Scholar]
- Parashurama N, Nahmias Y, Cho CH, van Poll D, Tilles AW, Berthiaume F, Yarmush ML. Activin alters the kinetics of endoderm induction in embryonic stem cells cultured on collagen gels. Stem Cells. 2008;26:474–484. doi: 10.1634/stemcells.2007-0303. [DOI] [PMC free article] [PubMed] [Google Scholar]
- Postic C, Shiota M, Niswender KD, Jetton TL, Chen Y, Moates JM, Shelton KD, Lindner J, Cherrington AD, Magnuson MA. Dual roles for glucokinase in glucose homeostasis as determined by liver and pancreatic β cell-specific gene knock-outs using cre recombinase. J Biol Chem. 1999;274:305–315. doi: 10.1074/jbc.274.1.305. [DOI] [PubMed] [Google Scholar]
- Pound LD, Oeser JK, O’Brien TP, Wang Y, Faulman CJ, Dadi PK, Jacobson DA, Hutton JC, McGuinness OP, Shiota M, O’Brien RM. G6PC2: a negative regulator of basal glucose-stimulated insulin secretion. Diabetes. 2013;62:1547–1556. doi: 10.2337/db12-1067. [DOI] [PMC free article] [PubMed] [Google Scholar]
- Printz RL, Granner DK. Tweaking the glucose sensor: adjusting glucokinase activity with activator compounds. Endocrinology. 2005;146:3693–3695. doi: 10.1210/en.2005-0689. [DOI] [PubMed] [Google Scholar]
- Saito M, Hayakawa A, Inagaki N, Matsuoka H. Development of novel cell lines of diabetic dysfunction model fit for cell-based screening tests of medicinal materials. Cytotechnology. 2013;65:105–118. doi: 10.1007/s10616-012-9466-x. [DOI] [PMC free article] [PubMed] [Google Scholar]
- Sakano D, Shiraki N, Kikawa K, Yamazoe T, Kataoka M, Umeda K, Araki K, Mao D, Matsumoto S, Nakagata N, Andersson O, Stainier D, Endo F, Kume K, Uesugi M, Kume S. VMAT2 identified as a regulator of late-stage β-cell differentiation. Nat Chem Biol. 2014;10:141–148. doi: 10.1038/nchembio.1410. [DOI] [PubMed] [Google Scholar]
- Schäfer MK, Hartwig NR, Kalmbach N, Klietz M, Anlauf M, Eiden LE, Weihe E. Species-specific vesicular monoamine transporter 2 (VMAT2) expression in mammalian pancreatic beta cells: implications for optimising radioligand-based human beta cell mass (BCM) imaging in animal models. Diabetologia. 2013;56:1047–1056. doi: 10.1007/s00125-013-2847-7. [DOI] [PMC free article] [PubMed] [Google Scholar]
- Sherwood RI, Jitianu C, Cleaver O, Shaywitz DA, Lamenzo JO, Chen AE, Golub TR, Melton DA. Prospective isolation and global gene expression analysis of definitive and visceral endoderm. Dev Biol. 2007;304:541–555. doi: 10.1016/j.ydbio.2007.01.011. [DOI] [PubMed] [Google Scholar]
- Soria B. In-vitro differentiation of pancreatic beta-cells. Differentiation. 2001;68:205–219. doi: 10.1046/j.1432-0436.2001.680408.x. [DOI] [PubMed] [Google Scholar]
- Stainier DY. A glimpse into the molecular entrails of endoderm formation. Genes Dev. 2002;16:893–907. doi: 10.1101/gad.974902. [DOI] [PubMed] [Google Scholar]
- Takeuchi H, Nakatsuji N, Suemori H. Endodermal differentiation of human pluripotent stem cells to insulin-producing cells in 3D culture. Sci Rep. 2014;4:4488. doi: 10.1038/srep04488. [DOI] [PMC free article] [PubMed] [Google Scholar]
- Tuch BE, Gao SY, Lees JG. Scaffolds for islets and stem cells differentiated into insulin-secreting cells. Front. Biosci. 2014;19:126–138. doi: 10.2741/4199. [DOI] [PubMed] [Google Scholar]
- Vallier L, Alexander M, Pedersen RA. Activin/Nodal and FGF pathways cooperate to maintain pluripotency of human embryonic stem cells. J Cell Sci. 2005;118:4495–4509. doi: 10.1242/jcs.02553. [DOI] [PubMed] [Google Scholar]
- Veras K, Almeida FN, Nachbar RT, de Jesus DS, Camporez JP, Carpinelli AR, Goedecke JH, de Oliveira Carvalho CR. DHEA supplementation in ovariectomized rats reduces impaired glucose-stimulated insulin secretion induced by a high-fat diet. FEBS Open Bio. 2014;4:141–146. doi: 10.1016/j.fob.2014.01.005. [DOI] [PMC free article] [PubMed] [Google Scholar]
- Yasunaga M, Tada S, Torikai-Nishikawa S, Nakano Y, Okada M, Jakt LM, Nishikawa S, Chiba T, Era T, Nishikawa S. Induction and monitoring of definitive and visceral endoderm differentiation of mouse ES cells. Nat Biotechnol. 2005;23:1542–1550. doi: 10.1038/nbt1167. [DOI] [PubMed] [Google Scholar]


